Bubblecar said:
Scientists have released new views of Saturn’s largest moon, Titan, taken by the Visual and Infrared Mapping Spectrometer (VIMS) instrument on the decommissioned Cassini spacecraft. They represent a lot of data that has been combined and smoothed out and they show a clear view of what the moon looks like under its dense atmosphere.
The centre, yellow image shows how Titan would look to human eyes. Around it are the six new infrared representations, rendered in colours that human eyes can see.
Each colour (red, green and blue) represents a ratio of the brightness of two different infrared wavelengths. This method is meant to highlight the materials that comprise the moon’s features while reducing image artefacts from combining the raw files.
Full Report

Wow!
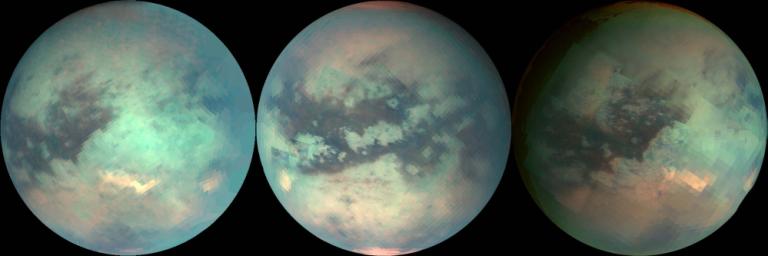
False colour of course. These are the more familiar images, examples of the data from which the new images have been derived, direct from the VMS camera.of Cassini.

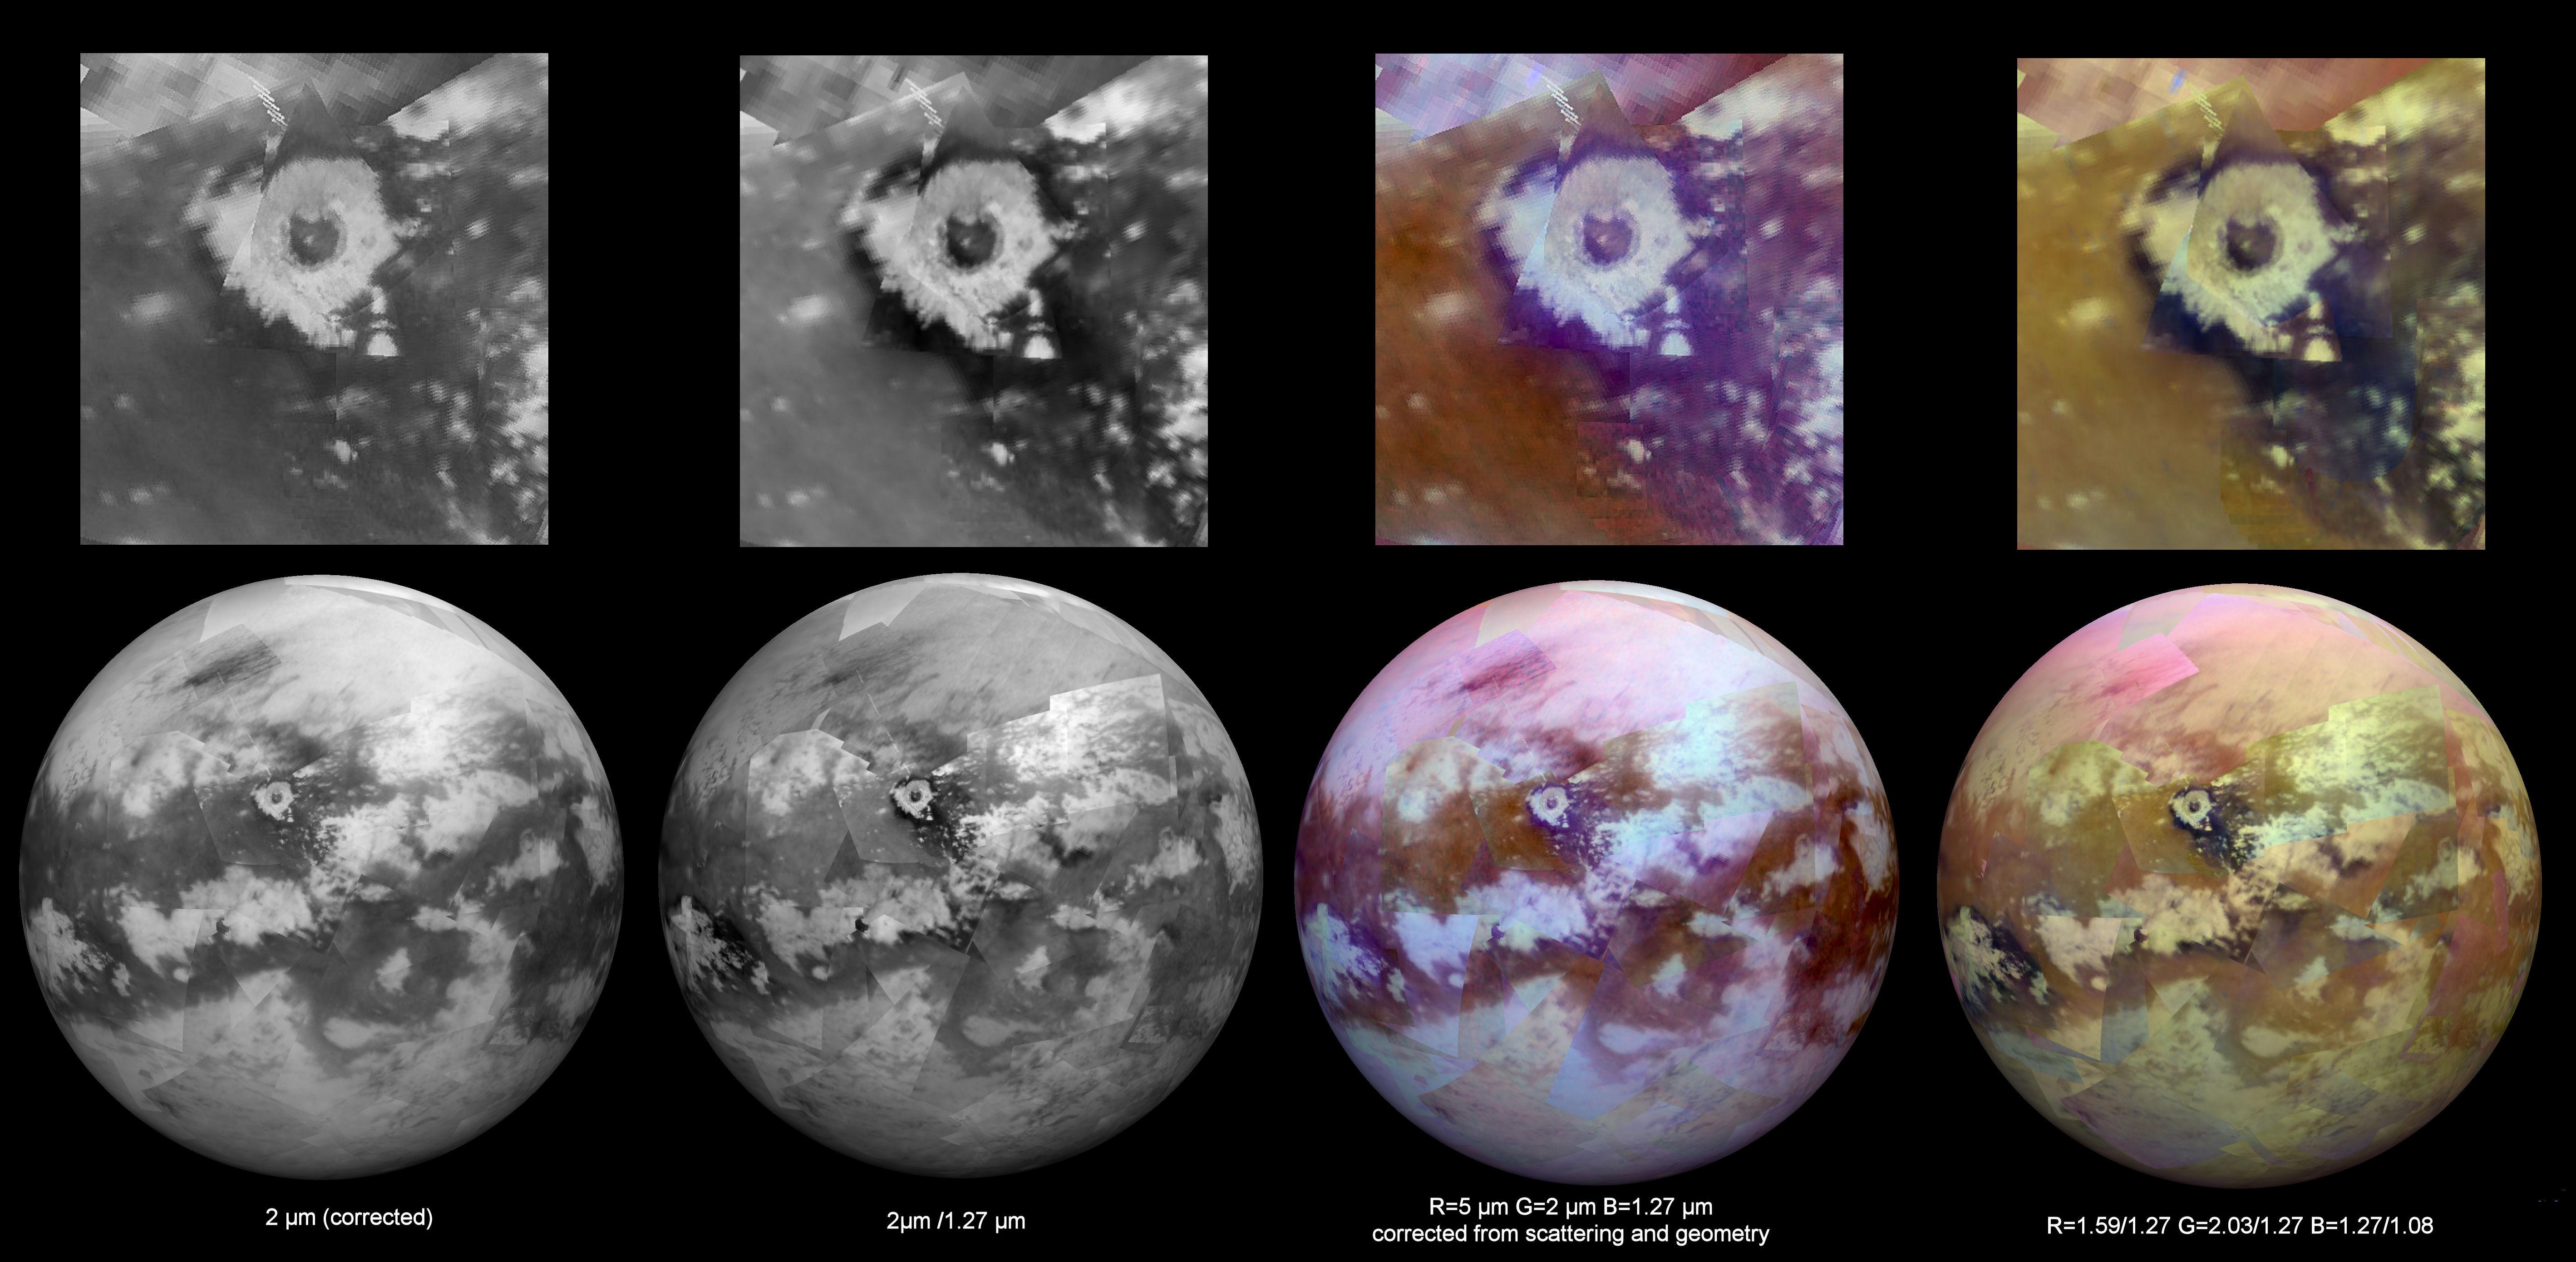
“Making mosaics of VIMS images of Titan has always been a challenge because the data were obtained over many different flybys with different observing geometries and atmospheric conditions. One result is that very prominent seams appear in the mosaics that are quite difficult for imaging scientists to remove. But, through laborious and detailed analyses of the data, along with time consuming hand processing of the mosaics, the seams have been mostly removed.”
The following image shows steps in processing.

“Each of the three color channels combined to create these views was produced using a ratio between the brightness of Titan’s surface at two different wavelengths (1.59/1.27 microns , 2.03/1.27 microns and 1.27/1.08 microns ). This technique (called a “band-ratio” technique) reduces the prominence of seams, as well as emphasizing subtle spectral variations in the materials on Titan’s surface. For example, the moon’s equatorial dune fields appear a consistent brown color here. There are also bluish and purplish areas that may have different compositions from the other bright areas, and may be enriched in water ice.”
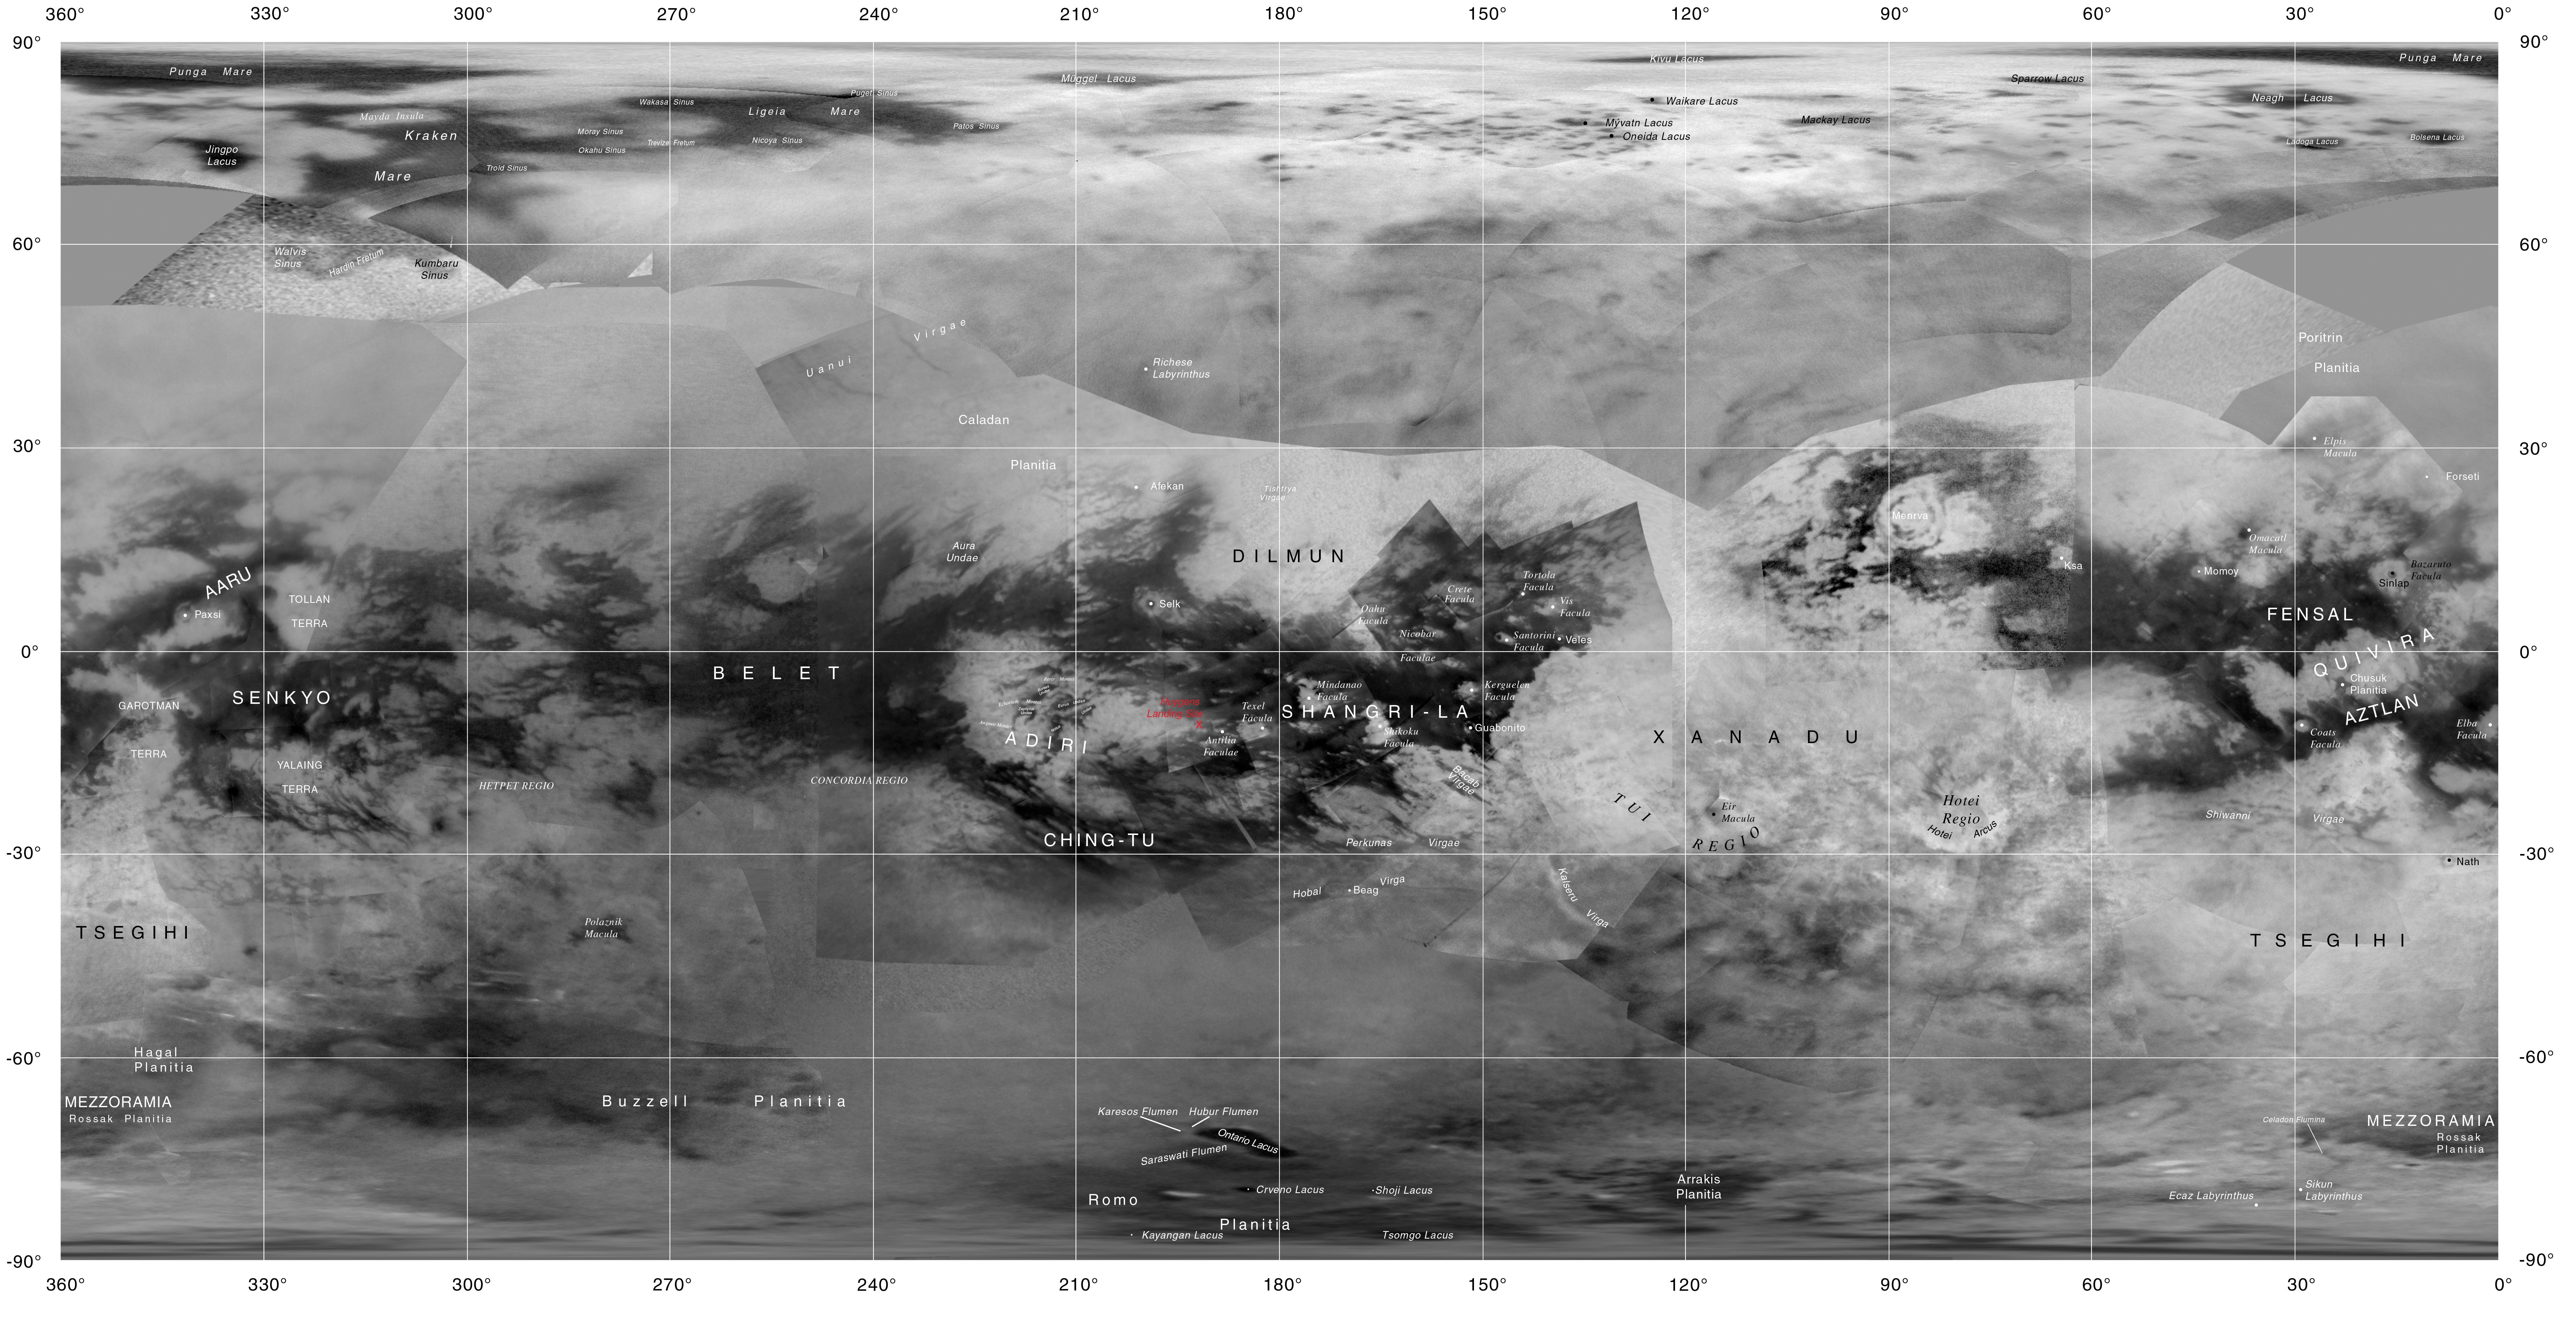
The following is a labeled map of Titan (you have to zoom in to see most of the labels).


