Date: 1/09/2018 13:13:11
From: Tau.Neutrino
ID: 1270194
Subject: Aerosols and Atmosphere...

Look at all the Aerosols Pushed into the Atmosphere, from Fires, Volcanoes and Pollution. Even Sea Salt Thrown into the Air from Hurricanes

Stand outside and take deep breath. Do you know what you’re breathing? For most people, the answer is simple – air. And air, which is essential to life as we know it, is composed of roughly twenty-percent oxygen gas (O²) and seventy-eight percent nitrogen gas (N²). However, within the remaining one-percent and change are several other trace gases, as well as few other ingredients that are not always healthy.

more…

Reply Quote

Date: 1/09/2018 13:17:05
From: Ian
ID: 1270195
Subject: re: Aerosols and Atmosphere...

Tau.Neutrino said:


Look at all the Aerosols Pushed into the Atmosphere, from Fires, Volcanoes and Pollution. Even Sea Salt Thrown into the Air from Hurricanes

Stand outside and take deep breath. Do you know what you’re breathing? For most people, the answer is simple – air. And air, which is essential to life as we know it, is composed of roughly twenty-percent oxygen gas (O²) and seventy-eight percent nitrogen gas (N²). However, within the remaining one-percent and change are several other trace gases, as well as few other ingredients that are not always healthy.

more…

…fkn dust

Reply Quote

Date: 1/09/2018 14:17:32
From: Ian
ID: 1270233
Subject: re: Aerosols and Atmosphere...

Interesting. The red is Black Carbon.

In Oz there is a hotspot in NT and a small one in north coast NSW.

Reply Quote

Date: 1/09/2018 20:41:24
From: mollwollfumble
ID: 1270433
Subject: re: Aerosols and Atmosphere...

Ian said:


Interesting. The red is Black Carbon.

In Oz there is a hotspot in NT and a small one in north coast NSW.

Tennant creek?

Fascinating. I used to study the sea salt pushed into the air by strong winds, the roaring forties, furious fifties, as well as hurricanes. I would have killed for data this good back then.

Reply Quote

Date: 1/09/2018 20:45:49
From: Boris
ID: 1270434
Subject: re: Aerosols and Atmosphere...

not Tennant Creek, more like around Katherine.

Reply Quote

Date: 1/09/2018 20:47:30
From: AwesomeO
ID: 1270435
Subject: re: Aerosols and Atmosphere...

mollwollfumble said:


Ian said:

Interesting. The red is Black Carbon.

In Oz there is a hotspot in NT and a small one in north coast NSW.

Tennant creek?

Fascinating. I used to study the sea salt pushed into the air by strong winds, the roaring forties, furious fifties, as well as hurricanes. I would have killed for data this good back then.

Black carbon is that soot from fires. So bushfires in oz, volcanic in the Indonesian area and cooking fires in South Africa?

Reply Quote

Date: 1/09/2018 20:47:42
From: Stumpy_seahorse
ID: 1270437
Subject: re: Aerosols and Atmosphere...

mollwollfumble said:


Ian said:

Interesting. The red is Black Carbon.

In Oz there is a hotspot in NT and a small one in north coast NSW.

Tennant creek?

Fascinating. I used to study the sea salt pushed into the air by strong winds, the roaring forties, furious fifties, as well as hurricanes. I would have killed for data this good back then.

you’re way off with tennant creek.. more like Timber Creek

Reply Quote

Date: 1/09/2018 20:47:53
From: party_pants
ID: 1270438
Subject: re: Aerosols and Atmosphere...

mollwollfumble said:


Ian said:

Interesting. The red is Black Carbon.

In Oz there is a hotspot in NT and a small one in north coast NSW.

Tennant creek?

Fascinating. I used to study the sea salt pushed into the air by strong winds, the roaring forties, furious fifties, as well as hurricanes. I would have killed for data this good back then.

TC is a bit further south.

Reply Quote

Date: 1/09/2018 20:48:27
From: party_pants
ID: 1270440
Subject: re: Aerosols and Atmosphere...

as you were :)

Reply Quote

Date: 1/09/2018 20:53:34
From: mollwollfumble
ID: 1270443
Subject: re: Aerosols and Atmosphere...

party_pants said:

TC is a bit further south.

OK, bushfire then. I couldn’t imagine that there was any industry in or around Katherine that was generating that much soot.

Reply Quote

Date: 1/09/2018 20:54:20
From: Boris
ID: 1270444
Subject: re: Aerosols and Atmosphere...

mollwollfumble said:


party_pants said:

TC is a bit further south.

OK, bushfire then. I couldn’t imagine that there was any industry in or around Katherine that was generating that much soot.

be dry season bushfire i would imagine. Top End is full of them at that time.

Reply Quote

Date: 1/09/2018 21:19:41
From: mollwollfumble
ID: 1270452
Subject: re: Aerosols and Atmosphere...

Following links gives.

https://gmao.gsfc.nasa.gov/reanalysis/MERRA-2/

The Modern-Era Retrospective analysis for Research and Applications, Version 2 (MERRA-2) provides data beginning in 1980. It was introduced to replace the original MERRA dataset because of the advances made in the assimilation system that enable assimilation of modern hyperspectral radiance and microwave observations, along with GPS-Radio Occultation datasets. It also uses NASA’s ozone profile observations that began in late 2004. Additional advances in both the GEOS model and the GSI assimilation system are included in MERRA-2. Spatial resolution is about 50 km in the latitudinal direction.

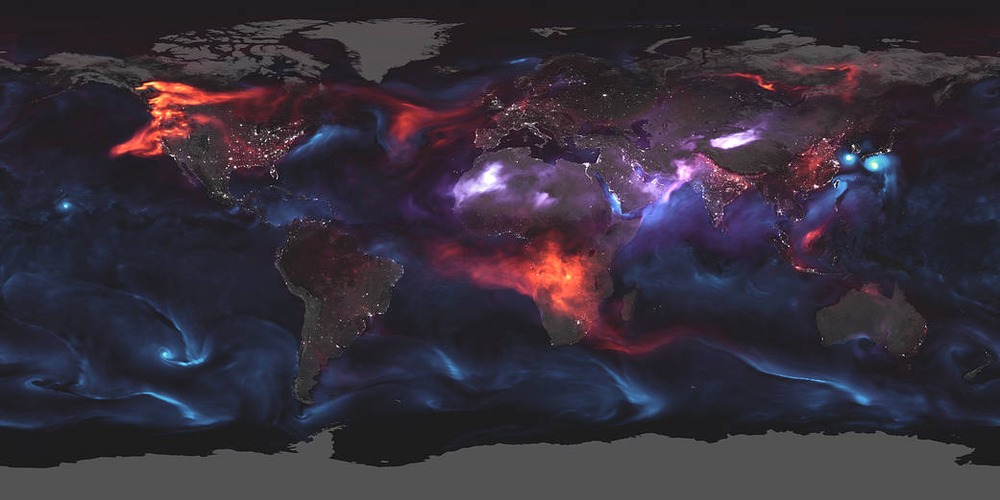
Along with the enhancements in the meteorological assimilation, MERRA-2 takes some significant steps towards GMAO’s target of an Earth System reanalysis. MERRA-2 is the first long-term global reanalysis to assimilate space-based observations of aerosols and represent their interactions with other physical processes in the climate system. MERRA-2 includes a representation of ice sheets over Greenland and Antarctica.

The Modern-Era Retrospective Analysis for Research and Applications, Version 2 (MERRA-2)

https://gmao.gsfc.nasa.gov/pubs/docs/Randles887.pdf

https://journals.ametsoc.org/doi/10.1175/JCLI-D-16-0758.1

I don’t know how to interpret the following graph. Why are some altitudes cooling while other altitudes are warming?

Aerosol concentrations.

Reply Quote

Date: 1/09/2018 21:51:09
From: mollwollfumble
ID: 1270463
Subject: re: Aerosols and Atmosphere...

mollwollfumble said:

Aerosol concentrations.


The increase in carbonaceous aerosols with time is worrying, particularly that in Asia. But what’s the main cause?

It could be

Reply Quote

Date: 2/09/2018 22:19:10
From: mollwollfumble
ID: 1270856
Subject: re: Aerosols and Atmosphere...

World map of aerosols. Monthly from March 2000 to May 2018.

https://earthobservatory.nasa.gov/global-maps/MODAL2_M_AER_OD

https://eoimages.gsfc.nasa.gov/images/globalmaps/data/mov/MODAL2_M_AER_OD.mov

World map of aerosol size. Monthly from Jan 2005 to Sep 2016.

https://earthobservatory.nasa.gov/global-maps/MODAL2_M_AER_RA

https://eoimages.gsfc.nasa.gov/images/globalmaps/data/mov/MODAL2_M_AER_RA.mov

The largest aerosols would be dust followed by sea salt. Sea salt is big at high latitudes where the mean wind speed is strongest.

Reply Quote

Date: 2/09/2018 22:48:07
From: mollwollfumble
ID: 1270862
Subject: re: Aerosols and Atmosphere...

mollwollfumble said:


World map of aerosols. Monthly from March 2000 to May 2018.

https://earthobservatory.nasa.gov/global-maps/MODAL2_M_AER_OD

https://eoimages.gsfc.nasa.gov/images/globalmaps/data/mov/MODAL2_M_AER_OD.mov

World map of aerosol size. Monthly from Jan 2005 to Sep 2016.

https://earthobservatory.nasa.gov/global-maps/MODAL2_M_AER_RA

https://eoimages.gsfc.nasa.gov/images/globalmaps/data/mov/MODAL2_M_AER_RA.mov

The largest aerosols would be dust followed by sea salt. Sea salt is big at high latitudes where the mean wind speed is strongest.

A must read for anyone with an interest in world climate and climate change.

https://earthobservatory.nasa.gov/global-maps

Lots of movies of many climatic parameters month by month movies and look at any month.

Look at the one for sea surface temperature to see El Nino in action. And if you want you can do a frame by frame comparison of El Nino and rainfall in Australia.

The most startling and strongest trend that I can see is visible in Russia in the map of Net Primary Productivity. Take a look.

Reply Quote

Date: 3/09/2018 04:44:33
From: mollwollfumble
ID: 1270869
Subject: re: Aerosols and Atmosphere...

mollwollfumble said:

A must read for anyone with an interest in world climate and climate change.

https://earthobservatory.nasa.gov/global-maps

The most startling and strongest trend that I can see is visible in Russia in the map of Net Primary Productivity. Take a look.

Not just Russia, all around the world (except for Florida).

Forest growth around the world, measured by net CO2 uptake by plants..

July 2000

July 2016

Reply Quote

Date: 3/09/2018 14:09:56
From: PermeateFree
ID: 1271009
Subject: re: Aerosols and Atmosphere...

mollwollfumble said:


mollwollfumble said:

A must read for anyone with an interest in world climate and climate change.

https://earthobservatory.nasa.gov/global-maps

The most startling and strongest trend that I can see is visible in Russia in the map of Net Primary Productivity. Take a look.

Not just Russia, all around the world (except for Florida).

Forest growth around the world, measured by net CO2 uptake by plants..

July 2000

July 2016


Co2 is a fertiliser for plants, but they still need water to use it and the climate needs to be within a compatible temperature range. We are currently at the beginning of major climate change, but things will change further with weather extremes. Research has shown faster plant growth due to co2 simulation causes disruption to forest ecosystems by encouraging rapid growth species, at the expense of naturally slower growing ones. This will lead to lack of diversity – not good!

Reply Quote