A very interesting video showing the events of ice melt on Greenland and how very irregular it occurs.
https://youtu.be/0S4T2Q8sBW8
https://www.abc.net.au/news/science/2018-12-06/greenland-ice-sheet-melting-accelerating/10581980
A very interesting video showing the events of ice melt on Greenland and how very irregular it occurs.
https://youtu.be/0S4T2Q8sBW8
https://www.abc.net.au/news/science/2018-12-06/greenland-ice-sheet-melting-accelerating/10581980
PermeateFree said:
A very interesting video showing the events of ice melt on Greenland and how very irregular it occurs.https://youtu.be/0S4T2Q8sBW8
https://www.abc.net.au/news/science/2018-12-06/greenland-ice-sheet-melting-accelerating/10581980
Yeah I saw that in the news.
Excellent video. But you should note that it stops in 2012.
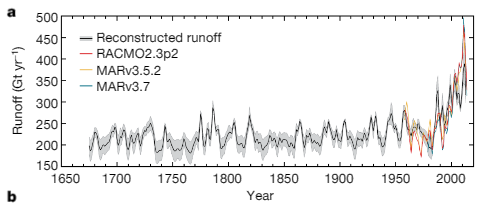
As it happens, I was looking up historical data on the melting rate of Greenland’s ice sheet last week. Because this was the core assumption / hypothesis in Al Gore’s “an inconvenient truth” and I wanted to find out what the real scientific facts were.
It looked like it was accelerating in the four years leading up to a peak melting rate in the year 2012, then after that, in every year from 2013 to 2018, the melting rate decreased. It was back to the pre-2005 average in 2018. I suppose “Greenland ice sheet melting rate decreasing” does not make good press.
Now to the Nature article, which is the basis for the latest news reports including the ABC one. The Nature article says “At all of our core sites, 2012 melt was more intense than any other year”. This is perfectly true. The Nature article data doesn’t include any data since 2016, so misses the low melting rates of 2017 and 2018. Old data.
I can see that I’ll have to find the source of the raw data again. There’s so much press in the past couple of days that Google has buried the scientific research.
So far, I have been unable to find any reliable calculation of how long it would take the Greenland ice sheet to melt at the current rate.
PermeateFree said:
A very interesting video showing the events of ice melt on Greenland and how very irregular it occurs.https://youtu.be/0S4T2Q8sBW8
https://www.abc.net.au/news/science/2018-12-06/greenland-ice-sheet-melting-accelerating/10581980
My sincere apologies. I reacted far too strongly to that.
The time delay between measurement and publication is always a pain. If this publication had appeared in 2013 or 2014 then it would have been cause for immediate and extreme concern. All I’m saying is that because of the consistent decline in melt rate in the years 2013 to 2018, back to pre-2005 levels, the problem has already started to self-correct. So although the melting rate of the Greenland ice cap is still a concern, the extremely high melting rate of 2012 is now seen to be more of a blip than as the start of an exponential growth.
This is the graph from Nature. So you can see that the increase in melting rate is a concern. It does not include the most recent data.

I can’t seem to find the raw most recent data on the web any more, I’ll try again later.
Now let’s extrapolate this. Or can we? What is the precipitation rate of snow?
Google (https://web.viu.ca/earle/geol305/The%20Greenland%20Ice%20Sheet.pdf) says that over 10 years, the loss of the Greenland ice sheet has been 0.05%. That’s a fraction of 0.005/100 per year. That translates to a loss of the Greenland ice sheet in about 20,000 years.
mollwollfumble said:
PermeateFree said:
A very interesting video showing the events of ice melt on Greenland and how very irregular it occurs.https://youtu.be/0S4T2Q8sBW8
https://www.abc.net.au/news/science/2018-12-06/greenland-ice-sheet-melting-accelerating/10581980
My sincere apologies. I reacted far too strongly to that.
The time delay between measurement and publication is always a pain. If this publication had appeared in 2013 or 2014 then it would have been cause for immediate and extreme concern. All I’m saying is that because of the consistent decline in melt rate in the years 2013 to 2018, back to pre-2005 levels, the problem has already started to self-correct. So although the melting rate of the Greenland ice cap is still a concern, the extremely high melting rate of 2012 is now seen to be more of a blip than as the start of an exponential growth.
This is the graph from Nature. So you can see that the increase in melting rate is a concern. It does not include the most recent data.
I can’t seem to find the raw most recent data on the web any more, I’ll try again later.
Now let’s extrapolate this. Or can we? What is the precipitation rate of snow?
Google (https://web.viu.ca/earle/geol305/The%20Greenland%20Ice%20Sheet.pdf) says that over 10 years, the loss of the Greenland ice sheet has been 0.05%. That’s a fraction of 0.005/100 per year. That translates to a loss of the Greenland ice sheet in about 20,000 years.
You miss the point, as you need to watch the video and then you will realise different things regarding ice melt happen at different rates due to different causes.