Date: 31/01/2019 15:46:51
From: Michael V
ID: 1338605
Subject: Global Warming.
Here: I’ve started a thread. It seems this is not chat.
Zeppelin said:
Witty Rejoinder said:
Zeppelin said:
what am i saying that isn’t true?
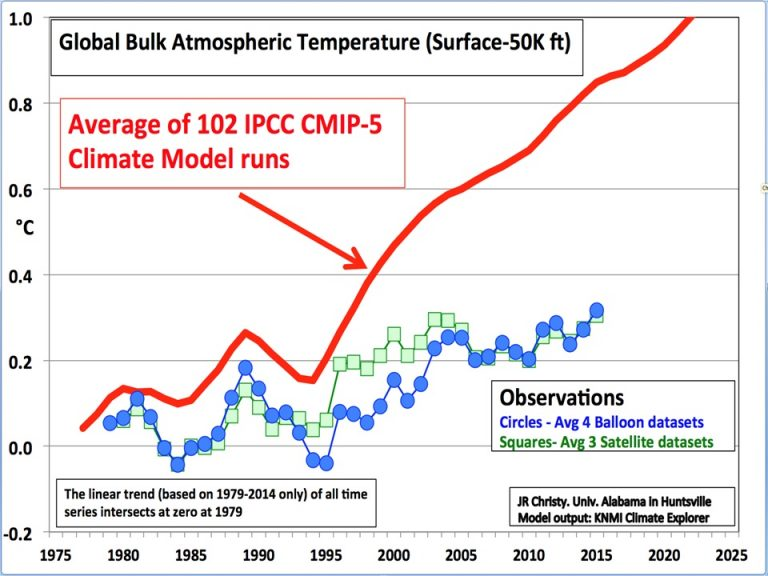
That the observed warming is less than the models predict.
Here’s the data for the UAH satellite https://www.nsstc.uah.edu/data/msu/v6.0/tlt/uahncdc_lt_6.0.txt
global lower tropospheric trend over the 40 year record >>> 0.13C. The model best guess works out to be 0.33C / decade.
Date: 31/01/2019 15:58:47
From: mollwollfumble
ID: 1338613
Subject: re: Global Warming.
Date: 31/01/2019 15:59:46
From: roughbarked
ID: 1338614
Subject: re: Global Warming.
Date: 31/01/2019 16:00:17
From: PermeateFree
ID: 1338615
Subject: re: Global Warming.
mollwollfumble said:
OK. Off topic but just saw it on the news.
https://www.abc.net.au/news/2019-01-31/parts-of-us-colder-than-antarctica-as-polar-vortex-grips-midwest/10765416
Goes to show, it must be bloody hot somewhere else.
Date: 31/01/2019 16:03:14
From: Zeppelin
ID: 1338617
Subject: re: Global Warming.
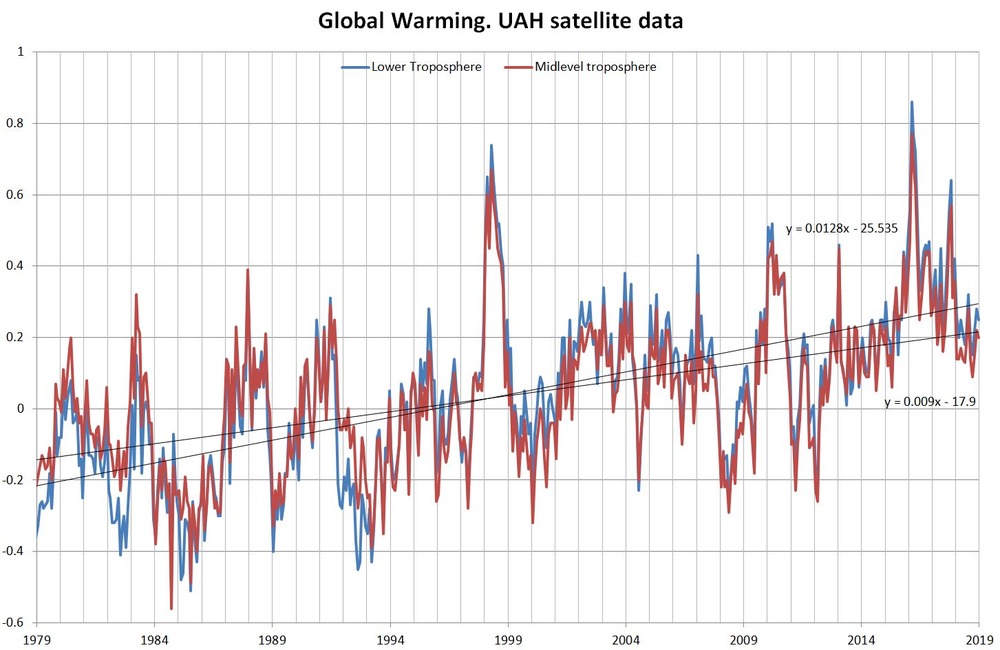
so here’s the sat data for lower troposphere
https://www.nsstc.uah.edu/data/msu/v6.0/tlt/uahncdc_lt_6.0.txt
0.13C/decade trend
the data for the mid troposphere shows a slower trend (0.09C/decade) as compared to the lower trop, not a faster trend as the greenhouse forcing theory dictates.
https://www.nsstc.uah.edu/data/msu/v6.0/tmt/uahncdc_mt_6.0.txt
this proves that, at best, only some of the 0.13C trend is due to gasses, or possibly none of it.
Date: 31/01/2019 17:08:05
From: mollwollfumble
ID: 1338706
Subject: re: Global Warming.
Zeppelin said:
so here’s the sat data for lower troposphere
https://www.nsstc.uah.edu/data/msu/v6.0/tlt/uahncdc_lt_6.0.txt
0.13C/decade trend
the data for the mid troposphere shows a slower trend (0.09C/decade) as compared to the lower trop, not a faster trend as the greenhouse forcing theory dictates.
https://www.nsstc.uah.edu/data/msu/v6.0/tmt/uahncdc_mt_6.0.txt
this proves that, at best, only some of the 0.13C trend is due to gasses, or possibly none of it.
Step 1. WTF is UAH?
Step 2. How reliable are those trends?
Step 3. What does theory dictate (back of envelope)?
Step 4. What do global climate models say?
Step 1. UAH = University of Alabama in Huntsville
“The UAH satellite temperature dataset, developed at the University of Alabama in Huntsville, infers the temperature of various atmospheric layers from satellite measurements of radiance. It was the first global temperature datasets developed from satellite information.”
Step 2. Downloading into Excel
Do you have the name of the datafile for the lower stratosphere?
From https://www.nsstc.uah.edu/data/msu/v6.0/tlt/uahncdc_lt_6.0.txt Lower troposphere
Temperature rise trend
Global 0.13
Land 0.18
Ocean 0.11 – cooler because of better thermal conductivity of ocean
Northern Hemisphere 0.15
Southern Hemisphere 0.10
Southern hemisphere ocean heated less than northern hemisphere ocean.
From https://www.nsstc.uah.edu/data/msu/v6.0/tlt/uahncdc_mt_6.0.txt Midlevel troposphere
Temperature rise trend
Global 0.09
Land 0.13
Ocean 0.08
Northern Hemisphere 0.11
Southern Hemisphere 0.07
Temperature increase in the midlevel troposphere is consistently less than in the lower troposphere.
Well there’s definitely a global warming trend there.
And looks like in the order of 0.01 degrees per year.
Date: 31/01/2019 17:09:37
From: ChrispenEvan
ID: 1338710
Subject: re: Global Warming.
UAH – The University of Alabama in Huntsville
Date: 31/01/2019 17:10:13
From: ChrispenEvan
ID: 1338714
Subject: re: Global Warming.
ChrispenEvan said:
UAH – The University of Alabama in Huntsville
i see you already know
Date: 31/01/2019 17:14:20
From: Zeppelin
ID: 1338719
Subject: re: Global Warming.
mollwollfumble said:
Zeppelin said:
so here’s the sat data for lower troposphere
https://www.nsstc.uah.edu/data/msu/v6.0/tlt/uahncdc_lt_6.0.txt
0.13C/decade trend
the data for the mid troposphere shows a slower trend (0.09C/decade) as compared to the lower trop, not a faster trend as the greenhouse forcing theory dictates.
https://www.nsstc.uah.edu/data/msu/v6.0/tmt/uahncdc_mt_6.0.txt
this proves that, at best, only some of the 0.13C trend is due to gasses, or possibly none of it.
Step 1. WTF is UAH?
Step 2. How reliable are those trends?
Step 3. What does theory dictate (back of envelope)?
Step 4. What do global climate models say?
Step 1. UAH = University of Alabama in Huntsville
“The UAH satellite temperature dataset, developed at the University of Alabama in Huntsville, infers the temperature of various atmospheric layers from satellite measurements of radiance. It was the first global temperature datasets developed from satellite information.”
Step 2. Downloading into Excel
Do you have the name of the datafile for the lower stratosphere?
From https://www.nsstc.uah.edu/data/msu/v6.0/tlt/uahncdc_lt_6.0.txt Lower troposphere
Temperature rise trend
Global 0.13
Land 0.18
Ocean 0.11 – cooler because of better thermal conductivity of ocean
Northern Hemisphere 0.15
Southern Hemisphere 0.10
Southern hemisphere ocean heated less than northern hemisphere ocean.
From https://www.nsstc.uah.edu/data/msu/v6.0/tlt/uahncdc_mt_6.0.txt Midlevel troposphere
Temperature rise trend
Global 0.09
Land 0.13
Ocean 0.08
Northern Hemisphere 0.11
Southern Hemisphere 0.07
Temperature increase in the midlevel troposphere is consistently less than in the lower troposphere.
Well there’s definitely a global warming trend there.
And looks like in the order of 0.01 degrees per year.
University of Alabama Huntsville. The pioneers of sat temp, NASA award winners. https://www.nsstc.uah.edu/climate/
Yes moll, there is a warming trend, but it is far less than model projections, & there is no proof that the trend, 0.13/decade is from greenhouse forcing. Going by the theory, it isn’t
Date: 31/01/2019 17:22:07
From: Zeppelin
ID: 1338726
Subject: re: Global Warming.
Another paper shows that climate models and climate reality vary – greatly
Our study documents pronounced differences between the observed and CMIP5-simulated climate variability in the twentieth century. These differences are dominated by a coherent multidecadal hemispheric-scale signal present in the observed SST and SLP fields but completely missing in any of the CMIP5 simulations.
Our results are also broadly consistent with recent analyses of Cheung et al. , who documented substantial mismatches between their estimated internal components of the observed and CMIP5-simulated AMO, PMO, and NMO variability. However, these authors used subtraction of the scaled CMIP5 MMEM signal to deduce the internal variability in historical simulations of individual CMIP5 models. Kravtsov et al. and Kravtsov and Callicutt showed that the residual variability so defined misrepresents the true internal variability in CMIP5 simulations and is, in fact, dominated by model error, that is, the differences between the true forced response of individual models and the MMEM response. The magnitude of the CMIP5 “internal” variability estimated by this method is, hence, much larger than that of the true simulated internal variability, and the spectral characteristics of the true and estimated internal variability are entirely different.
https://agupubs.onlinelibrary.wiley.com/doi/full/10.1002/2017GL074016
Date: 31/01/2019 17:24:19
From: Zeppelin
ID: 1338729
Subject: re: Global Warming.
A Test of the Tropical 200‐ to 300‐hPa Warming Rate in Climate Models
https://agupubs.onlinelibrary.wiley.com/doi/full/10.1029/2018EA000401
Abstract
Overall climate sensitivity to CO2 doubling in a general circulation model results from a complex system of parameterizations in combination with the underlying model structure. We refer to this as the model’s major hypothesis, and we assume it to be testable. We explain four criteria that a valid test should meet: measurability, specificity, independence, and uniqueness. We argue that temperature change in the tropical 200‐ to 300‐hPa layer meets these criteria. Comparing modeled to observed trends over the past 60 years using a persistence‐robust variance estimator shows that all models warm more rapidly than observations and in the majority of individual cases the discrepancy is statistically significant. We argue that this provides informative evidence against the major hypothesis in most current climate models.
Date: 31/01/2019 17:25:02
From: gaghalfrunt
ID: 1338731
Subject: re: Global Warming.
Zeppelin said:
Another paper shows that climate models and climate reality vary – greatly
Our study documents pronounced differences between the observed and CMIP5-simulated climate variability in the twentieth century. These differences are dominated by a coherent multidecadal hemispheric-scale signal present in the observed SST and SLP fields but completely missing in any of the CMIP5 simulations.
Our results are also broadly consistent with recent analyses of Cheung et al. , who documented substantial mismatches between their estimated internal components of the observed and CMIP5-simulated AMO, PMO, and NMO variability. However, these authors used subtraction of the scaled CMIP5 MMEM signal to deduce the internal variability in historical simulations of individual CMIP5 models. Kravtsov et al. and Kravtsov and Callicutt showed that the residual variability so defined misrepresents the true internal variability in CMIP5 simulations and is, in fact, dominated by model error, that is, the differences between the true forced response of individual models and the MMEM response. The magnitude of the CMIP5 “internal” variability estimated by this method is, hence, much larger than that of the true simulated internal variability, and the spectral characteristics of the true and estimated internal variability are entirely different.
https://agupubs.onlinelibrary.wiley.com/doi/full/10.1002/2017GL074016
And your point being?
Date: 31/01/2019 17:31:28
From: mollwollfumble
ID: 1338737
Subject: re: Global Warming.
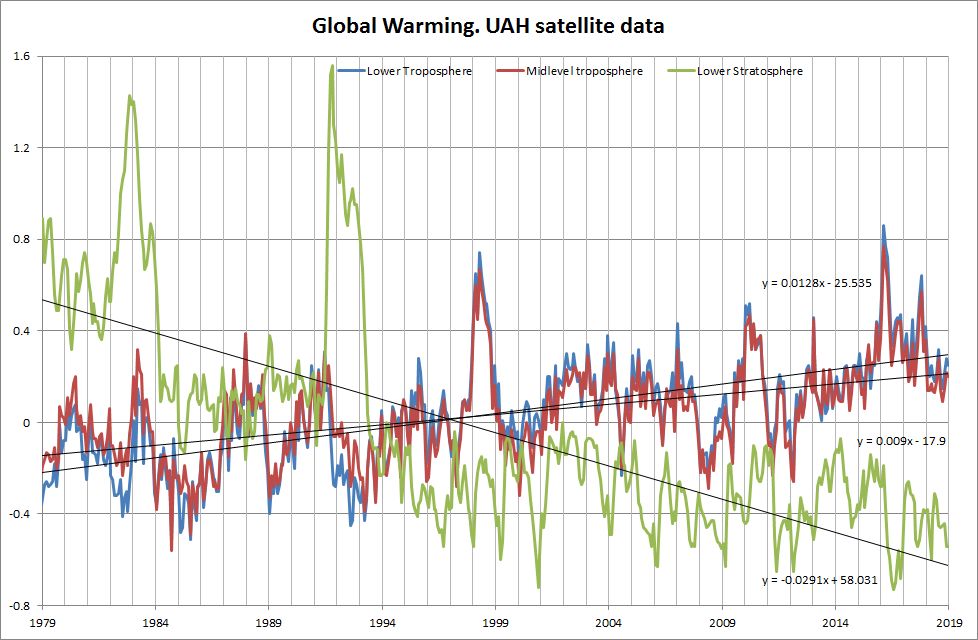
https://www.nsstc.uah.edu/data/msu/v6.0/tls/uahncdc_ls_6.0.txt
is the lower stratosphere file.
In the lower stratosphere we have a global cooling. A greater global cooling than the global warming in the troposphere. Essentially identical over land and ocean, over northern and southern hemisphere, and over tropics.
-0.03 degrees C per year.
Date: 31/01/2019 17:53:10
From: mollwollfumble
ID: 1338749
Subject: re: Global Warming.
Apologies to CrispenEven, I was thinking out loud.
> Step 2. How reliable are those trends?
Next step is to calculate the standard error on the slope. Fairly obviously, if I happened to choose the decade 1998 to 2008 then I would get a totally different result for global warming in the lower and middle troposphere.
How to calculate the standard error on the slope in Excel?
AND
How to subtract the autocorrelation before calculating the standard error on the slope.
Date: 31/01/2019 17:57:25
From: The Rev Dodgson
ID: 1338751
Subject: re: Global Warming.
mollwollfumble said:
Apologies to CrispenEven, I was thinking out loud.
> Step 2. How reliable are those trends?
Next step is to calculate the standard error on the slope. Fairly obviously, if I happened to choose the decade 1998 to 2008 then I would get a totally different result for global warming in the lower and middle troposphere.
How to calculate the standard error on the slope in Excel?
Linest function, or display it on an XY(Scatter) chart.
mollwollfumble said:
AND
How to subtract the autocorrelation before calculating the standard error on the slope.
Why do you want to do that?
Date: 31/01/2019 18:14:35
From: roughbarked
ID: 1338763
Subject: re: Global Warming.
gaghalfrunt said:
Zeppelin said:
Another paper shows that climate models and climate reality vary – greatly
Our study documents pronounced differences between the observed and CMIP5-simulated climate variability in the twentieth century. These differences are dominated by a coherent multidecadal hemispheric-scale signal present in the observed SST and SLP fields but completely missing in any of the CMIP5 simulations.
Our results are also broadly consistent with recent analyses of Cheung et al. , who documented substantial mismatches between their estimated internal components of the observed and CMIP5-simulated AMO, PMO, and NMO variability. However, these authors used subtraction of the scaled CMIP5 MMEM signal to deduce the internal variability in historical simulations of individual CMIP5 models. Kravtsov et al. and Kravtsov and Callicutt showed that the residual variability so defined misrepresents the true internal variability in CMIP5 simulations and is, in fact, dominated by model error, that is, the differences between the true forced response of individual models and the MMEM response. The magnitude of the CMIP5 “internal” variability estimated by this method is, hence, much larger than that of the true simulated internal variability, and the spectral characteristics of the true and estimated internal variability are entirely different.
https://agupubs.onlinelibrary.wiley.com/doi/full/10.1002/2017GL074016
And your point being?
I was going to ask that but you did anyway.
Date: 31/01/2019 22:19:38
From: mollwollfumble
ID: 1338904
Subject: re: Global Warming.
The Rev Dodgson said:
mollwollfumble said:
How to subtract the autocorrelation before calculating the standard error on the slope.
Why do you want to do that?
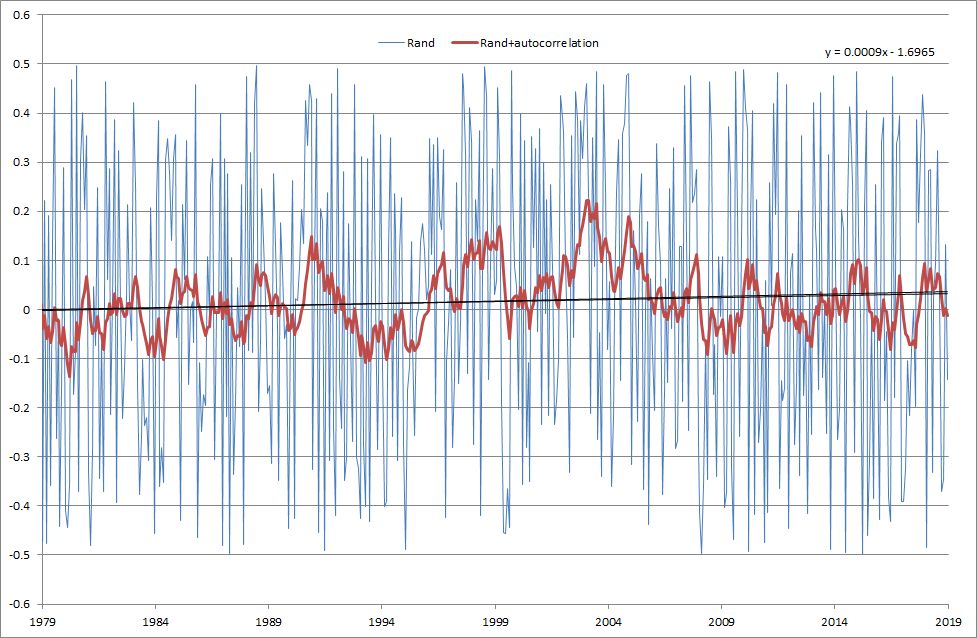
I’m not sure that I can explain easily.
In the following two graphs the data is truly random (random number generator). The only difference is that the red data has autocorrelation added.
Both have the same trendline. The autocorrelation makes the trend look more believable, even though the trend is no more accurate than for the data without autocorrelation.
Date: 31/01/2019 22:31:19
From: transition
ID: 1338912
Subject: re: Global Warming.
dumb Q perhaps
how much direct heating does human activity contribute to global warming.
Date: 31/01/2019 22:32:59
From: Witty Rejoinder
ID: 1338914
Subject: re: Global Warming.
You make maths sexy again Moll.
Date: 31/01/2019 22:34:42
From: The Rev Dodgson
ID: 1338918
Subject: re: Global Warming.
transition said:
dumb Q perhaps
how much direct heating does human activity contribute to global warming.
Next to nothing.
Date: 31/01/2019 22:39:55
From: Witty Rejoinder
ID: 1338920
Subject: re: Global Warming.
The Rev Dodgson said:
transition said:
dumb Q perhaps
how much direct heating does human activity contribute to global warming.
Next to nothing.
I think we need to properly ascertain what Onty means by direct heating.
Date: 31/01/2019 22:41:49
From: transition
ID: 1338921
Subject: re: Global Warming.
Witty Rejoinder said:
The Rev Dodgson said:
transition said:
dumb Q perhaps
how much direct heating does human activity contribute to global warming.
Next to nothing.
I think we need to properly ascertain what Onty means by direct heating.
any burning of fuel generates heat, for example
Date: 31/01/2019 22:44:27
From: Peak Warming Man
ID: 1338922
Subject: re: Global Warming.
transition said:
Witty Rejoinder said:
The Rev Dodgson said:
Next to nothing.
I think we need to properly ascertain what Onty means by direct heating.
any burning of fuel generates heat, for example
Yeah, IC engines being cooled by radiating the heat into the atmosphere planes/ships/cars/trucks, billions of them 24/7.
But apparently it’s bugger all in the great scheme of things.
Date: 31/01/2019 22:48:24
From: AwesomeO
ID: 1338923
Subject: re: Global Warming.
Peak Warming Man said:
transition said:
Witty Rejoinder said:
I think we need to properly ascertain what Onty means by direct heating.
any burning of fuel generates heat, for example
Yeah, IC engines being cooled by radiating the heat into the atmosphere planes/ships/cars/trucks, billions of them 24/7.
But apparently it’s bugger all in the great scheme of things.
Well a city is pretty much all heat, or at least changes the natural pattern of heat, radiating constantly you would expect that to influence something, especially when you get into mega cities and merging with thousands of acres of suburban roads and roofs.
Date: 31/01/2019 22:48:34
From: transition
ID: 1338924
Subject: re: Global Warming.
Peak Warming Man said:
transition said:
Witty Rejoinder said:
I think we need to properly ascertain what Onty means by direct heating.
any burning of fuel generates heat, for example
Yeah, IC engines being cooled by radiating the heat into the atmosphere planes/ships/cars/trucks, billions of them 24/7.
But apparently it’s bugger all in the great scheme of things.
thing is though what’s the amount of sunshine equal to mid latitudes at midday?(ground level) a KW?
what humans burn per square metre (averaged) is fairly substantial I would have thought
Date: 31/01/2019 22:51:25
From: Michael V
ID: 1338925
Subject: re: Global Warming.
Peak Warming Man said:
transition said:
Witty Rejoinder said:
I think we need to properly ascertain what Onty means by direct heating.
any burning of fuel generates heat, for example
Yeah, IC engines being cooled by radiating the heat into the atmosphere planes/ships/cars/trucks, billions of them 24/7.
But apparently it’s bugger all in the great scheme of things.
Well there you go. I though he mean “direct heating by human activity”, like exercise, digging the garden, walking, etc.
Date: 31/01/2019 22:57:58
From: transition
ID: 1338926
Subject: re: Global Warming.
transition said:
Peak Warming Man said:
transition said:
any burning of fuel generates heat, for example
Yeah, IC engines being cooled by radiating the heat into the atmosphere planes/ships/cars/trucks, billions of them 24/7.
But apparently it’s bugger all in the great scheme of things.
thing is though what’s the amount of sunshine equal to mid latitudes at midday?(ground level) a KW?
what humans burn per square metre (averaged) is fairly substantial I would have thought
tomorrow night there will he nine people in house here, couple hundred watts each (homeostasis etc), TV on, lights on, heated swimming pool, HWS, AC, electronic gadgets, water pumped to the house and held at pressure, there’s food from the supermarket that was produced elsewhere (and transported), and there’re trips in the cars, holidays overseas in jets. Seems like a shitload of energy to me.
Date: 31/01/2019 23:04:52
From: PermeateFree
ID: 1338927
Subject: re: Global Warming.
transition said:
transition said:
Peak Warming Man said:
Yeah, IC engines being cooled by radiating the heat into the atmosphere planes/ships/cars/trucks, billions of them 24/7.
But apparently it’s bugger all in the great scheme of things.
thing is though what’s the amount of sunshine equal to mid latitudes at midday?(ground level) a KW?
what humans burn per square metre (averaged) is fairly substantial I would have thought
tomorrow night there will he nine people in house here, couple hundred watts each (homeostasis etc), TV on, lights on, heated swimming pool, HWS, AC, electronic gadgets, water pumped to the house and held at pressure, there’s food from the supermarket that was produced elsewhere (and transported), and there’re trips in the cars, holidays overseas in jets. Seems like a shitload of energy to me.
Meanwhile in Wisconsin ….
and yes it still works!

Date: 31/01/2019 23:05:53
From: transition
ID: 1338928
Subject: re: Global Warming.
transition said:
transition said:
Peak Warming Man said:
Yeah, IC engines being cooled by radiating the heat into the atmosphere planes/ships/cars/trucks, billions of them 24/7.
But apparently it’s bugger all in the great scheme of things.
thing is though what’s the amount of sunshine equal to mid latitudes at midday?(ground level) a KW?
what humans burn per square metre (averaged) is fairly substantial I would have thought
tomorrow night there will he nine people in house here, couple hundred watts each (homeostasis etc), TV on, lights on, heated swimming pool, HWS, AC, electronic gadgets, water pumped to the house and held at pressure, there’s food from the supermarket that was produced elsewhere (and transported), and there’re trips in the cars, holidays overseas in jets. Seems like a shitload of energy to me.
we’re discussing how much energy i’m burning sitting here, this planet sized brain idling etc..
Date: 31/01/2019 23:07:32
From: transition
ID: 1338930
Subject: re: Global Warming.
PermeateFree said:
transition said:
transition said:
thing is though what’s the amount of sunshine equal to mid latitudes at midday?(ground level) a KW?
what humans burn per square metre (averaged) is fairly substantial I would have thought
tomorrow night there will he nine people in house here, couple hundred watts each (homeostasis etc), TV on, lights on, heated swimming pool, HWS, AC, electronic gadgets, water pumped to the house and held at pressure, there’s food from the supermarket that was produced elsewhere (and transported), and there’re trips in the cars, holidays overseas in jets. Seems like a shitload of energy to me.
Meanwhile in Wisconsin ….
and yes it still works!
:)
don’t let the big fella get frozen to the side, you’ll be needing a friend with a hairdryer.
Date: 31/01/2019 23:10:54
From: Michael V
ID: 1338931
Subject: re: Global Warming.
transition said:
transition said:
Peak Warming Man said:
Yeah, IC engines being cooled by radiating the heat into the atmosphere planes/ships/cars/trucks, billions of them 24/7.
But apparently it’s bugger all in the great scheme of things.
thing is though what’s the amount of sunshine equal to mid latitudes at midday?(ground level) a KW?
what humans burn per square metre (averaged) is fairly substantial I would have thought
tomorrow night there will he nine people in house here, couple hundred watts each (homeostasis etc), TV on, lights on, heated swimming pool, HWS, AC, electronic gadgets, water pumped to the house and held at pressure, there’s food from the supermarket that was produced elsewhere (and transported), and there’re trips in the cars, holidays overseas in jets. Seems like a shitload of energy to me.
Another (somewhat easier) method is to consider how much energy is mined (coal, oil, gas) and how much energy is eaten (food). All of that energy is ultimately converted to heat. Add that up.
There’s 10s of thousands of tonnes of coal equivalent energy mined (lets say 35 Mj/kg). There’s probably about 5000 kj of energy eaten per person. That’s 5 MJ per person per day.
So, it’s an awful lot of energy.
Date: 31/01/2019 23:12:09
From: transition
ID: 1338933
Subject: re: Global Warming.
Michael V said:
transition said:
transition said:
thing is though what’s the amount of sunshine equal to mid latitudes at midday?(ground level) a KW?
what humans burn per square metre (averaged) is fairly substantial I would have thought
tomorrow night there will he nine people in house here, couple hundred watts each (homeostasis etc), TV on, lights on, heated swimming pool, HWS, AC, electronic gadgets, water pumped to the house and held at pressure, there’s food from the supermarket that was produced elsewhere (and transported), and there’re trips in the cars, holidays overseas in jets. Seems like a shitload of energy to me.
Another (somewhat easier) method is to consider how much energy is mined (coal, oil, gas) and how much energy is eaten (food). All of that energy is ultimately converted to heat. Add that up.
There’s 10s of thousands of tonnes of coal equivalent energy mined (lets say 35 Mj/kg). There’s probably about 5000 kj of energy eaten per person. That’s 5 MJ per person per day.
So, it’s an awful lot of energy.
that’s what I reckon
Date: 31/01/2019 23:13:25
From: Witty Rejoinder
ID: 1338934
Subject: re: Global Warming.
transition said:
Michael V said:
transition said:
tomorrow night there will he nine people in house here, couple hundred watts each (homeostasis etc), TV on, lights on, heated swimming pool, HWS, AC, electronic gadgets, water pumped to the house and held at pressure, there’s food from the supermarket that was produced elsewhere (and transported), and there’re trips in the cars, holidays overseas in jets. Seems like a shitload of energy to me.
Another (somewhat easier) method is to consider how much energy is mined (coal, oil, gas) and how much energy is eaten (food). All of that energy is ultimately converted to heat. Add that up.
There’s 10s of thousands of tonnes of coal equivalent energy mined (lets say 35 Mj/kg). There’s probably about 5000 kj of energy eaten per person. That’s 5 MJ per person per day.
So, it’s an awful lot of energy.
that’s what I reckon
Compared to sunshine?
Date: 31/01/2019 23:23:18
From: sibeen
ID: 1338936
Subject: re: Global Warming.
Witty Rejoinder said:
transition said:
Michael V said:
Another (somewhat easier) method is to consider how much energy is mined (coal, oil, gas) and how much energy is eaten (food). All of that energy is ultimately converted to heat. Add that up.
There’s 10s of thousands of tonnes of coal equivalent energy mined (lets say 35 Mj/kg). There’s probably about 5000 kj of energy eaten per person. That’s 5 MJ per person per day.
So, it’s an awful lot of energy.
that’s what I reckon
Compared to sunshine?
Nah, SFA. A square meter gets on average about 21 MJ of energy per day.
Date: 31/01/2019 23:25:20
From: Michael V
ID: 1338937
Subject: re: Global Warming.
Michael V said:
transition said:
transition said:
thing is though what’s the amount of sunshine equal to mid latitudes at midday?(ground level) a KW?
what humans burn per square metre (averaged) is fairly substantial I would have thought
tomorrow night there will he nine people in house here, couple hundred watts each (homeostasis etc), TV on, lights on, heated swimming pool, HWS, AC, electronic gadgets, water pumped to the house and held at pressure, there’s food from the supermarket that was produced elsewhere (and transported), and there’re trips in the cars, holidays overseas in jets. Seems like a shitload of energy to me.
Another (somewhat easier) method is to consider how much energy is mined (coal, oil, gas) and how much energy is eaten (food). All of that energy is ultimately converted to heat. Add that up.
There’s 10s of thousands billions of tonnes of coal equivalent energy mined (lets say 35 Mj/kg). There’s probably about 5000 kj of energy eaten per person. That’s 5 MJ per person per day.
So, it’s an awful lot of energy.
(corrected – thousands —-> billions)
So, 7.53 billion people times 5 Mj times 365 = 13,742.25 billion MJ
(say) 30 billion tonnes times 1000 times 34Mj = 102,000 billion MJ
So 116 trillion MJ of heat energy per year.
Date: 31/01/2019 23:33:51
From: Michael V
ID: 1338938
Subject: re: Global Warming.
sibeen said:
Witty Rejoinder said:
transition said:
that’s what I reckon
Compared to sunshine?
Nah, SFA. A square meter gets on average about 21 MJ of energy per day.
Surface area of the earth is 510.1 trillion m²
times 21 times 365 = 3,909,916.5 trillion MJ. From sunshine
And 116 trillion MJ of heat energy per year from Humans.
So about .003%
Date: 31/01/2019 23:36:10
From: sibeen
ID: 1338939
Subject: re: Global Warming.
Michael V said:
sibeen said:
Witty Rejoinder said:
Compared to sunshine?
Nah, SFA. A square meter gets on average about 21 MJ of energy per day.
Surface area of the earth is 510.1 trillion m²
times 21 times 365 = 3,909,916.5 trillion MJ. From sunshine
And 116 trillion MJ of heat energy per year from Humans.
So about .003%
Was just doing the calcs, MV. You beat me to it :)
Date: 31/01/2019 23:38:30
From: transition
ID: 1338940
Subject: re: Global Warming.
Michael V said:
sibeen said:
Witty Rejoinder said:
Compared to sunshine?
Nah, SFA. A square meter gets on average about 21 MJ of energy per day.
Surface area of the earth is 510.1 trillion m²
times 21 times 365 = 3,909,916.5 trillion MJ. From sunshine
And 116 trillion MJ of heat energy per year from Humans.
So about .003%
I haven’t looked up sun output variability, be quite a bit more than that I guess.
Date: 31/01/2019 23:42:10
From: Michael V
ID: 1338941
Subject: re: Global Warming.
sibeen said:
Michael V said:
sibeen said:
Nah, SFA. A square meter gets on average about 21 MJ of energy per day.
Surface area of the earth is 510.1 trillion m²
times 21 times 365 = 3,909,916.5 trillion MJ. From sunshine
And 116 trillion MJ of heat energy per year from Humans.
So about .003%
Was just doing the calcs, MV. You beat me to it :)
:)
Date: 31/01/2019 23:46:10
From: Michael V
ID: 1338942
Subject: re: Global Warming.
transition said:
Michael V said:
sibeen said:
Nah, SFA. A square meter gets on average about 21 MJ of energy per day.
Surface area of the earth is 510.1 trillion m²
times 21 times 365 = 3,909,916.5 trillion MJ. From sunshine
And 116 trillion MJ of heat energy per year from Humans.
So about .003%
I haven’t looked up sun output variability, be quite a bit more than that I guess.
It’s all ball-park. Halve the sun’s output, ten times the human input. Multiply by 20.
0.003% times 20 = 0.6%
Date: 31/01/2019 23:49:03
From: Michael V
ID: 1338943
Subject: re: Global Warming.
Michael V said:
transition said:
Michael V said:
Surface area of the earth is 510.1 trillion m²
times 21 times 365 = 3,909,916.5 trillion MJ. From sunshine
And 116 trillion MJ of heat energy per year from Humans.
So about .003%
I haven’t looked up sun output variability, be quite a bit more than that I guess.
It’s all ball-park. Halve the sun’s output, ten times the human input. Multiply by 20.
0.003% times 20 = 0.6%
Correction, sorry:
0.06%
Date: 31/01/2019 23:51:21
From: sibeen
ID: 1338944
Subject: re: Global Warming.
Michael V said:
Michael V said:
transition said:
I haven’t looked up sun output variability, be quite a bit more than that I guess.
It’s all ball-park. Halve the sun’s output, ten times the human input. Multiply by 20.
0.003% times 20 = 0.6%
Correction, sorry:
0.06%
Stop trying to be an engineer!
Date: 31/01/2019 23:53:09
From: Michael V
ID: 1338945
Subject: re: Global Warming.
Michael V said:
Michael V said:
transition said:
I haven’t looked up sun output variability, be quite a bit more than that I guess.
It’s all ball-park. Halve the sun’s output, ten times the human input. Multiply by 20.
0.003% times 20 = 0.6%
Correction, sorry:
0.06%
So, bugger all.
The real problem is two-fold:
Burning the fuel adds CO2 to the atmosphere – causing capture of more of the sun’s energy (rather than reflecting it), and
Burning the fuel allows more modification (mostly destruction) of the ecosphere.
Date: 31/01/2019 23:55:17
From: Michael V
ID: 1338946
Subject: re: Global Warming.
sibeen said:
Michael V said:
Michael V said:
It’s all ball-park. Halve the sun’s output, ten times the human input. Multiply by 20.
0.003% times 20 = 0.6%
Correction, sorry:
0.06%
Stop trying to be an engineer!
OK, I put my hand up, I made an engineering error. I didn’t carry a zero…
Date: 31/01/2019 23:59:15
From: Michael V
ID: 1338947
Subject: re: Global Warming.
Michael V said:
sibeen said:
Michael V said:
Correction, sorry:
0.06%
Stop trying to be an engineer!
OK, I put my hand up, I made an engineering error. I didn’t carry a zero…
Anyway, I blame the wine, rum-n-campari, sake and more wine.
Oh wait…
EtOH is another engineer’s thing. Bloody.
OK, I blame my nearly teetotal (sort of) engineer father. He’s dead. So that’s OK…
Date: 1/02/2019 05:27:24
From: roughbarked
ID: 1338968
Subject: re: Global Warming.
sibeen said:
Witty Rejoinder said:
transition said:
that’s what I reckon
Compared to sunshine?
Nah, SFA. A square meter gets on average about 21 MJ of energy per day.
I know some meters are square but many are also round.
Date: 1/02/2019 05:41:16
From: roughbarked
ID: 1338973
Subject: re: Global Warming.
I know that Z wants us to see that the models were overestimating what is really going down and hence trying to force play upon inconsistency but the one unavoidable constant is the ever increasing rise of temperatures overall.
Date: 1/02/2019 08:46:13
From: The Rev Dodgson
ID: 1339007
Subject: re: Global Warming.
I’m glad the lengthy discussion eventually arrived at the original answer.
Date: 1/02/2019 09:37:54
From: ruby
ID: 1339022
Subject: re: Global Warming.
‘The reason deniers claim the satellite data is superior is that they want to discredit the surface temperature (thermometer) record, and that’s because the surface data show so much warming. But among the satellite data sets, there’s one which shows far less warming: UAH TMT. Odd that these days they make a habit of showing that one, the one satellite data set which shows the least warming and correlates least with balloon data. Come to think of it, it’s not odd at all…’
From here-
https://tamino.wordpress.com/2016/11/27/which-satellite-data/
Date: 1/02/2019 09:38:56
From: roughbarked
ID: 1339023
Subject: re: Global Warming.
The Rev Dodgson said:
I’m glad the lengthy discussion eventually arrived at the original answer.
:)
Date: 1/02/2019 10:00:50
From: The Rev Dodgson
ID: 1339029
Subject: re: Global Warming.
ruby said:
‘The reason deniers claim the satellite data is superior is that they want to discredit the surface temperature (thermometer) record, and that’s because the surface data show so much warming. But among the satellite data sets, there’s one which shows far less warming: UAH TMT. Odd that these days they make a habit of showing that one, the one satellite data set which shows the least warming and correlates least with balloon data. Come to think of it, it’s not odd at all…’
From here-
https://tamino.wordpress.com/2016/11/27/which-satellite-data/
TATE on cherry-picking is quite good:
https://en.wikipedia.org/wiki/Cherry_picking
Date: 1/02/2019 10:09:18
From: The Rev Dodgson
ID: 1339030
Subject: re: Global Warming.
ruby said:
‘The reason deniers claim the satellite data is superior is that they want to discredit the surface temperature (thermometer) record, and that’s because the surface data show so much warming. But among the satellite data sets, there’s one which shows far less warming: UAH TMT. Odd that these days they make a habit of showing that one, the one satellite data set which shows the least warming and correlates least with balloon data. Come to think of it, it’s not odd at all…’
From here-
https://tamino.wordpress.com/2016/11/27/which-satellite-data/
Link now read.
Good information, answering many unasked questions :)
Date: 1/02/2019 10:47:25
From: ruby
ID: 1339037
Subject: re: Global Warming.
The Rev Dodgson said:
ruby said:
‘The reason deniers claim the satellite data is superior is that they want to discredit the surface temperature (thermometer) record, and that’s because the surface data show so much warming. But among the satellite data sets, there’s one which shows far less warming: UAH TMT. Odd that these days they make a habit of showing that one, the one satellite data set which shows the least warming and correlates least with balloon data. Come to think of it, it’s not odd at all…’
From here-
https://tamino.wordpress.com/2016/11/27/which-satellite-data/
Link now read.
Good information, answering many unasked questions :)
Yes, I look forward to Zeppelin finding it and the cherry picking article most illuminating too.
Date: 1/02/2019 16:12:24
From: mollwollfumble
ID: 1339209
Subject: re: Global Warming.
ruby said:
The Rev Dodgson said:
ruby said:
‘The reason deniers claim the satellite data is superior is that they want to discredit the surface temperature (thermometer) record, and that’s because the surface data show so much warming. But among the satellite data sets, there’s one which shows far less warming: UAH TMT. Odd that these days they make a habit of showing that one, the one satellite data set which shows the least warming and correlates least with balloon data. Come to think of it, it’s not odd at all…’
From here-
https://tamino.wordpress.com/2016/11/27/which-satellite-data/
Link now read.
Good information, answering many unasked questions :)
Yes, I look forward to Zeppelin finding it and the cherry picking article most illuminating too.
The UAH data is the longest record. With anything climate-related it’s essential to have the longest record possible.
In 1990 I was working with someone who was making a climate record of Australia. The problem was, less than 200 years of data, reliable and otherwise, was nowhere near long enough to accurately characterise the Australian climate.
Date: 1/02/2019 16:16:25
From: PermeateFree
ID: 1339214
Subject: re: Global Warming.
mollwollfumble said:
ruby said:
The Rev Dodgson said:
Link now read.
Good information, answering many unasked questions :)
Yes, I look forward to Zeppelin finding it and the cherry picking article most illuminating too.
The UAH data is the longest record. With anything climate-related it’s essential to have the longest record possible.
In 1990 I was working with someone who was making a climate record of Australia. The problem was, less than 200 years of data, reliable and otherwise, was nowhere near long enough to accurately characterise the Australian climate.
https://i.imgur.com/uiJcJol.mp4
Date: 1/02/2019 22:56:37
From: mollwollfumble
ID: 1339456
Subject: re: Global Warming.
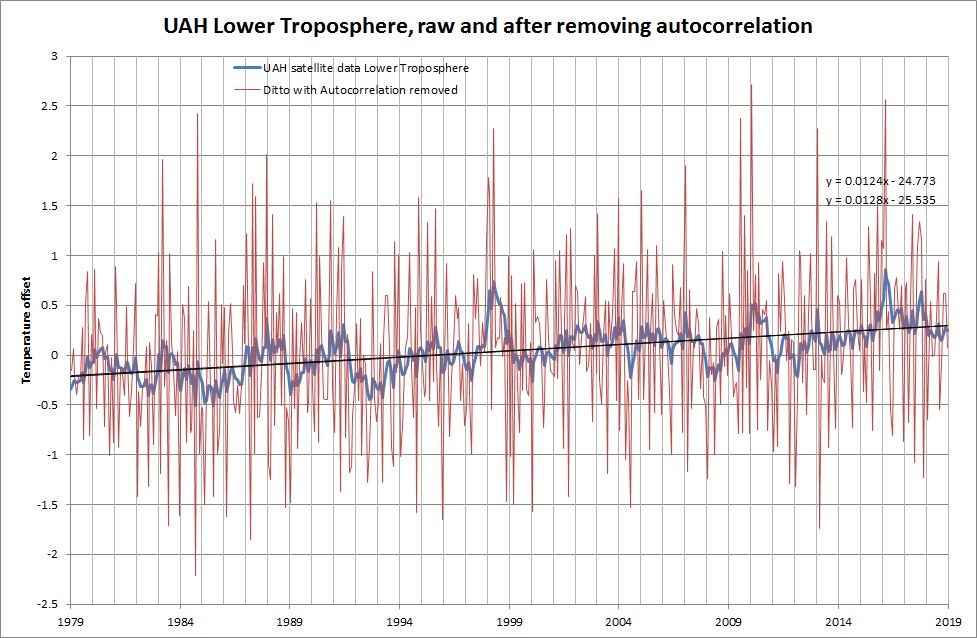
UAH lower troposphere data.
Blue line – as recorded
Red line – with autocorrelation removed
The autocorrelation turned out to be 0.85 per month. If it had been as high as 1.0 per month then the data would have been a random walk, in which case the slope would have been meaningless.
The removal of autocorrelation doesn’t actually mean anything on its own, but is it a necessary first step in calculating the standard error on the slope. Both datasets have the same trend line.
You can see already that the standard error on the slope from the red data will be quite substantial.
Date: 2/02/2019 06:51:29
From: mollwollfumble
ID: 1339474
Subject: re: Global Warming.
Got it.
Global warming in the lower troposphere is 0.013 +- 0.003 degrees per year.
That gives it a sigma level of 0.013/0.003 = 4.
So the probability that global warming is not real is … tiny
Date: 2/02/2019 06:56:17
From: roughbarked
ID: 1339475
Subject: re: Global Warming.
https://www.accuweather.com/en/videos/lamp-posts-freeze-over-in-stunning-images/5rowu2ade6lkxlmzhz840a0zhwvvvwak!
Date: 2/02/2019 07:32:05
From: roughbarked
ID: 1339484
Subject: re: Global Warming.
https://www.accuweather.com/en/videos/lamp-posts-freeze-over-in-stunning-images/5rowu2ade6lkxlmzhz840a0zhwvvvwak
Date: 2/02/2019 09:07:59
From: Michael V
ID: 1339499
Subject: re: Global Warming.
For mollwollfumble , from chat, in case you missed it:
From: Michael V
ID: 1339396
Subject: re: February Chat 2019.
mollwollfumble said:
PMSL.
————————————————————————————————————
Michael V said:
Why?
————————————————————————————————————
mollwollfumble said:
“The Ross River Dam is 186 per cent full, according to the latest reading at 3pm on Friday.”
I think somebody needs to learn what per cent means.
————————————————————————————————————
Michael V said:
Oh, OK.
This is dam engineer-speak. 100% dam fill is the maximum safe water level, usually around half the over-top amount. A dam over-top event is a catastrophic event that can ( likely) lead to dam failure. Often earth-walled dams (like Ross River Dam) have fuses built into them around 180-190% This results in huge uncontrolled releases and major (but not irreparable) damage to the dam. Around 120-150% the engineers get very concerned and try to rid the dam of water.
Date: 2/02/2019 10:26:49
From: mollwollfumble
ID: 1339546
Subject: re: Global Warming.
Date: 2/02/2019 10:29:16
From: Ogmog
ID: 1339547
Subject: re: Global Warming.
Howd-ee Y’all!
Jest passin’ thru
but I thought I’d innerject
that Huntsville, Ala-fuckin-bama
is a Climate Denier’s Wet-Dream…
DEEEEEP South, Obamar Hatin’
Make Merica Great Agin’ TRUMP CUNTry
(Coal Country)
As you were, carryon
Date: 2/02/2019 10:43:50
From: Ogmog
ID: 1339564
Subject: re: Global Warming.
Date: 2/02/2019 11:20:53
From: Ogmog
ID: 1339589
Subject: re: Global Warming.
Michael V said:
Here: I’ve started a thread. It seems this is not chat.
Zeppelin said:
Witty Rejoinder said:
That the observed warming is less than the models predict.
Here’s the data for the UAH satellite https://www.nsstc.uah.edu/data/msu/v6.0/tlt/uahncdc_lt_6.0.txt
global lower tropospheric trend over the 40 year record >>> 0.13C. The model best guess works out to be 0.33C / decade.
The Melting Arctic Ice has Disrupted the Normal “Flow” of the Jet Stream
Date: 2/02/2019 16:24:06
From: PermeateFree
ID: 1339720
Subject: re: Global Warming.
Michael V said:
For mollwollfumble , from chat, in case you missed it:
From: Michael V
ID: 1339396
Subject: re: February Chat 2019.
mollwollfumble said:
PMSL.
————————————————————————————————————
Michael V said:
Why?
————————————————————————————————————
mollwollfumble said:
“The Ross River Dam is 186 per cent full, according to the latest reading at 3pm on Friday.”
I think somebody needs to learn what per cent means.
————————————————————————————————————
Michael V said:
Oh, OK.
This is dam engineer-speak. 100% dam fill is the maximum safe water level, usually around half the over-top amount. A dam over-top event is a catastrophic event that can ( likely) lead to dam failure. Often earth-walled dams (like Ross River Dam) have fuses built into them around 180-190% This results in huge uncontrolled releases and major (but not irreparable) damage to the dam. Around 120-150% the engineers get very concerned and try to rid the dam of water.
On the radio this morning that the dam was now at 200%.
Date: 2/02/2019 16:38:23
From: Tamb
ID: 1339724
Subject: re: Global Warming.
PermeateFree said:
Michael V said:
For mollwollfumble , from chat, in case you missed it:
From: Michael V
ID: 1339396
Subject: re: February Chat 2019.
mollwollfumble said:
PMSL.
————————————————————————————————————
Michael V said:
Why?
————————————————————————————————————
mollwollfumble said:
“The Ross River Dam is 186 per cent full, according to the latest reading at 3pm on Friday.”
I think somebody needs to learn what per cent means.
————————————————————————————————————
Michael V said:
Oh, OK.
This is dam engineer-speak. 100% dam fill is the maximum safe water level, usually around half the over-top amount. A dam over-top event is a catastrophic event that can ( likely) lead to dam failure. Often earth-walled dams (like Ross River Dam) have fuses built into them around 180-190% This results in huge uncontrolled releases and major (but not irreparable) damage to the dam. Around 120-150% the engineers get very concerned and try to rid the dam of water.
On the radio this morning that the dam was now at 200%.
Koombooloomba dam has a fabridam which, when inflated, increases the capacity to over 100%.
Date: 2/02/2019 16:44:48
From: Michael V
ID: 1339726
Subject: re: Global Warming.
PermeateFree said:
Michael V said:
For mollwollfumble , from chat, in case you missed it:
From: Michael V
ID: 1339396
Subject: re: February Chat 2019.
mollwollfumble said:
PMSL.
————————————————————————————————————
Michael V said:
Why?
————————————————————————————————————
mollwollfumble said:
“The Ross River Dam is 186 per cent full, according to the latest reading at 3pm on Friday.”
I think somebody needs to learn what per cent means.
————————————————————————————————————
Michael V said:
Oh, OK.
This is dam engineer-speak. 100% dam fill is the maximum safe water level, usually around half the over-top amount. A dam over-top event is a catastrophic event that can ( likely) lead to dam failure. Often earth-walled dams (like Ross River Dam) have fuses built into them around 180-190% This results in huge uncontrolled releases and major (but not irreparable) damage to the dam. Around 120-150% the engineers get very concerned and try to rid the dam of water.
On the radio this morning that the dam was now at 200%.
Scary. I wonder what the failure capacity is.
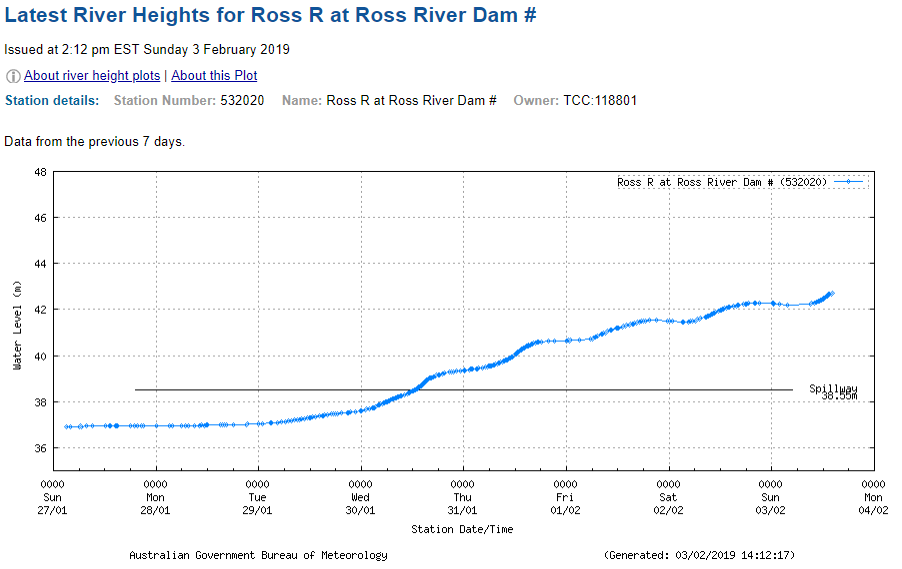
In the meantime, the latest depth from BoM (reference below):
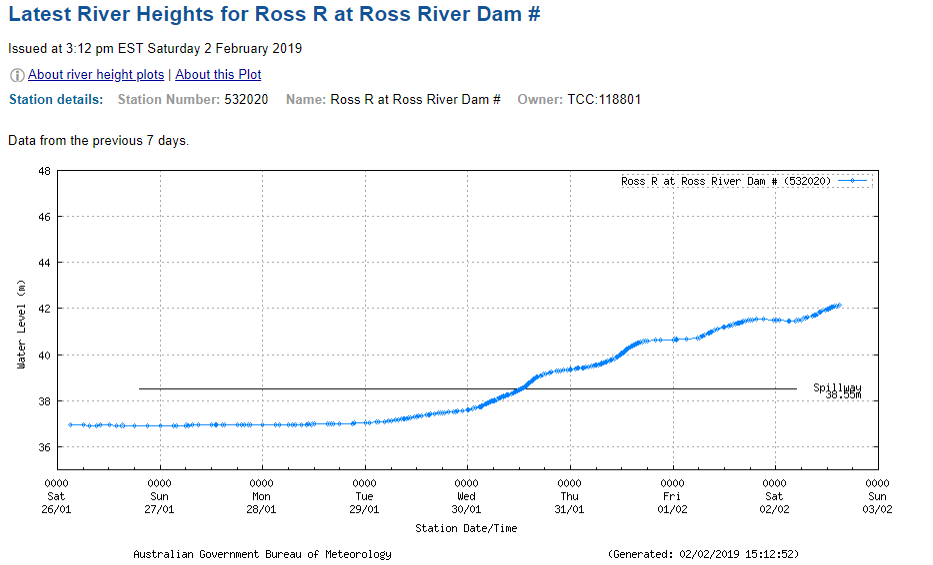
http://www.bom.gov.au/fwo/IDQ65393/IDQ65393.532020.plt.shtml
Date: 2/02/2019 17:07:00
From: Michael V
ID: 1339738
Subject: re: Global Warming.
Michael V said:
PermeateFree said:
Michael V said:
For mollwollfumble , from chat, in case you missed it:
From: Michael V
ID: 1339396
Subject: re: February Chat 2019.
mollwollfumble said:
PMSL.
————————————————————————————————————
Michael V said:
Why?
————————————————————————————————————
mollwollfumble said:
“The Ross River Dam is 186 per cent full, according to the latest reading at 3pm on Friday.”
I think somebody needs to learn what per cent means.
————————————————————————————————————
Michael V said:
Oh, OK.
This is dam engineer-speak. 100% dam fill is the maximum safe water level, usually around half the over-top amount. A dam over-top event is a catastrophic event that can ( likely) lead to dam failure. Often earth-walled dams (like Ross River Dam) have fuses built into them around 180-190% This results in huge uncontrolled releases and major (but not irreparable) damage to the dam. Around 120-150% the engineers get very concerned and try to rid the dam of water.
On the radio this morning that the dam was now at 200%.
Scary. I wonder what the failure capacity is.
In the meantime, the latest depth from BoM (reference below):
http://www.bom.gov.au/fwo/IDQ65393/IDQ65393.532020.plt.shtml
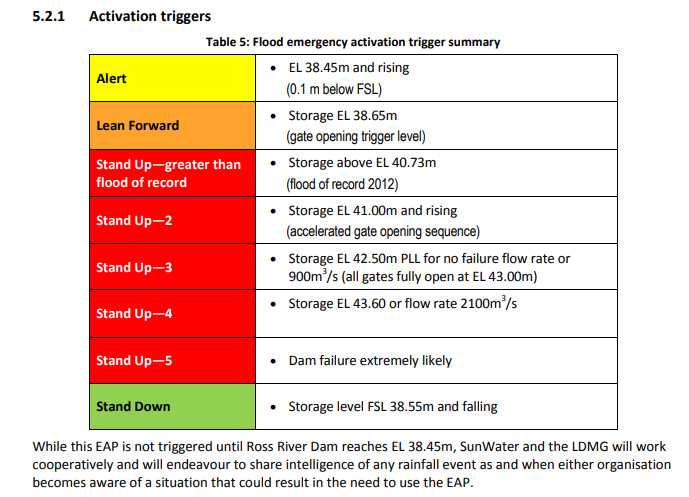
Well into the standup sequence:
Date: 2/02/2019 17:21:34
From: Michael V
ID: 1339745
Subject: re: Global Warming.
Sorry. I meant to reference the Emergency Action Plan. The dam wall is 8.4 km long!
http://data.dnrm.qld.gov.au/eap/ross-river-eap.pdf
Date: 2/02/2019 17:50:31
From: Ian
ID: 1339760
Subject: re: Global Warming.
Michael V said:
The dam wall is 8.4 km long!
That explains a few things.
Date: 2/02/2019 17:52:45
From: sibeen
ID: 1339761
Subject: re: Global Warming.
Ian said:
Michael V said:
The dam wall is 8.4 km long!
That explains a few things.
The length of the wall being one of them.
Date: 3/02/2019 02:20:32
From: sarahs mum
ID: 1339873
Subject: re: Global Warming.
https://www.washingtonpost.com/lifestyle/style/everything-is-not-going-to-be-okay-how-to-live-with-constant-reminders-that-the-earth-is-in-trouble/2019/01/24/9dd9d6e6-1e53-11e9-8b59-0a28f2191131_story.html?fbclid=IwAR3cprI0fPDtk9jXHmvgH2lTBJqC_VyEvlO0Y3dT2J5q9-QW_w3uzV-R-h4&utm_term=.2d45b0677b79
Date: 3/02/2019 15:28:35
From: Michael V
ID: 1340193
Subject: re: Global Warming.
Michael V said:
Michael V said:
PermeateFree said:
On the radio this morning that the dam was now at 200%.
Scary. I wonder what the failure capacity is.
In the meantime, the latest depth from BoM (reference below):
http://www.bom.gov.au/fwo/IDQ65393/IDQ65393.532020.plt.shtml
Well into the standup sequence:
Ross River Dam has been rising quite quickly again: