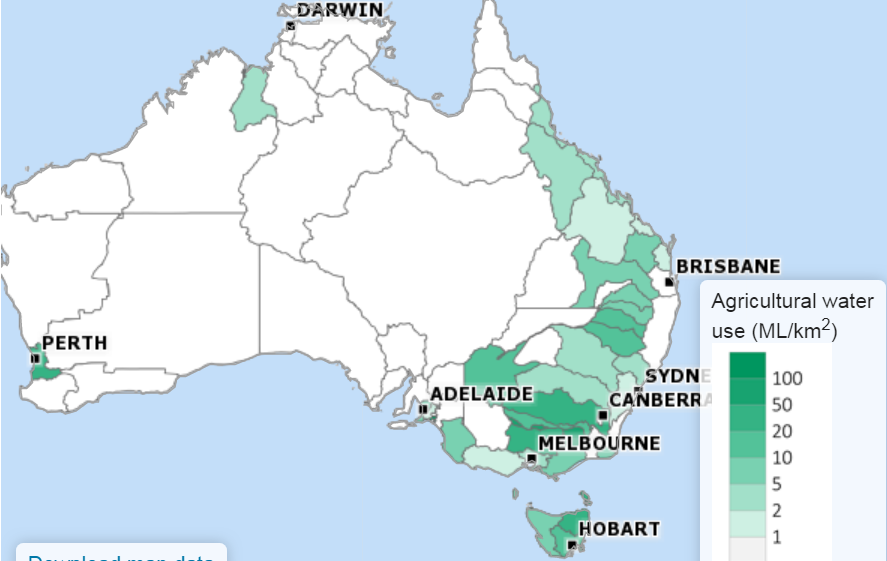
I thought it would be interesting to compare Australia’s water supply and usage changes between 1977 and 2017.
Starting with the Murray-Darling in 1977, from the book “The first survey of water use in Australia”.
Overview.
1 megalitre = 1000 cubic metres.
Murray-Darling 1977
Area 1.063 million km^2
Population 1.547 million
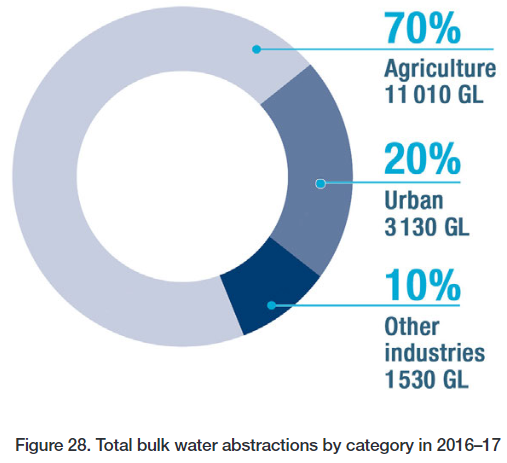
Urban/industrial water use 337 gigalitres = 3%
Irrigation 10,700 gigalitres = 91%
Other rural water use 775 gigalitres = 6%
Australia-wide 1977
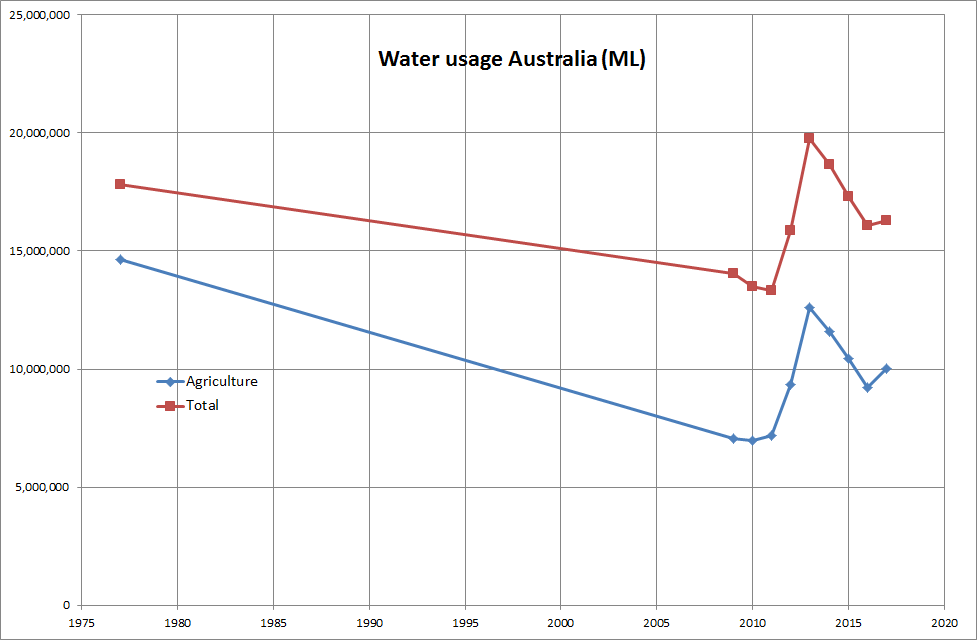
82% of water use is for agriculture. That’s a higher percentage than almost all other countries.
Note that water supply does not include farm dams or bores, but does include “private” surface and groundwater supplies.
That 10,700 gigalitres for irrigation is split between:
7,320 public surface water
2,900 private surface water
1 public groundwater
503 private groundwater
Water losses in irrigation, seepage and evaporation
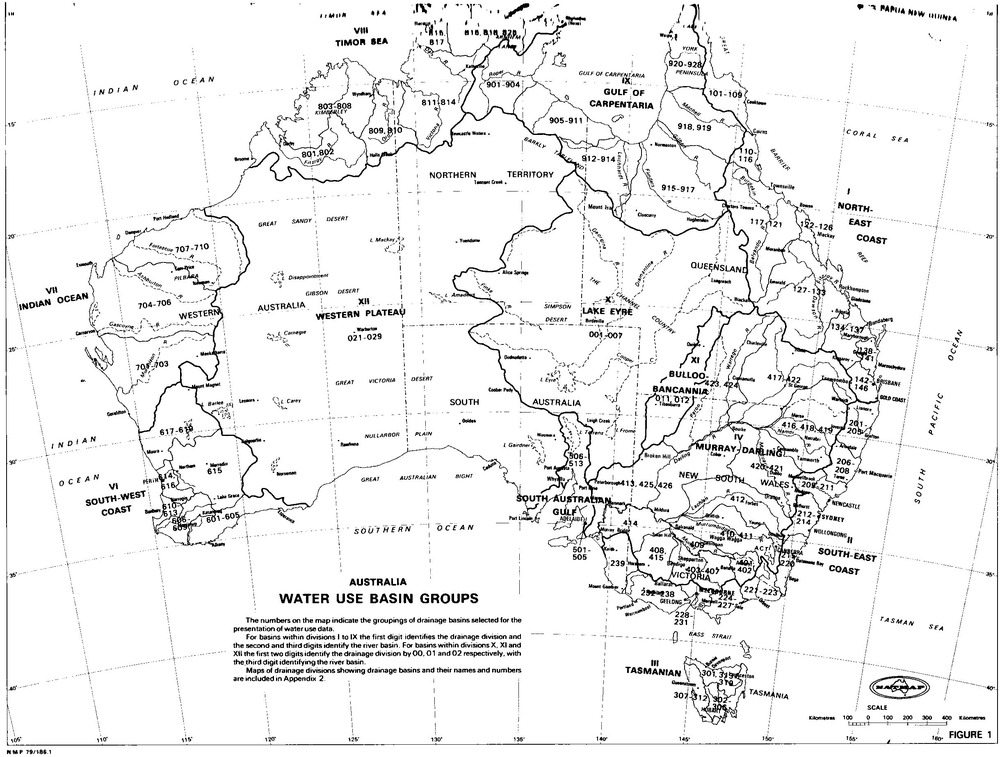
Basin 403-407, 23% of 2840 gigalitres
Basin 409, 16% of 1400 gigalitres
Basin 408 & 415, 26% of 31 gigalitres
Basin 410 & 411, 18% of 2330 gigalitres
Basin 412, 21% of 126 gigalitres
Basin 414, 12% of 40 gigalitres
Basins 401 & 402 = Upper Murray and Kiewa Rivers (Wodonga)
Basins 403-407 = Ovens, Broken, Goulburn, Campese and Loddon Rivers (Bendigo, Shepparton, Wangaratta)
Basin 409 = Murray Riverina (Horsham)
Basins 408 & 415 = Avoca, Wimmera and Avon Rivers (Albury)
Basins 410 & 411 = Murrumbidgee River, Lake George and Canberra water supply (Canberra, Queanbeyan, Wagga Wagga, Griffith)
Basin 412 = Lachlan River (Parkes)
Basins 413, 425 & 426 = Benanee, Darling River and Lower Murray (Broken Hill, Murray Bridge)
Basin 414 = Mallee in Vic & SA (Mildura)
Basin 416, 418 & 419 = Border Rivers in Qld & NSW, Gwydir River and Namoi River (Tamworth, Inverell, Moree)
Basin 417 & 422 = Moonie, Condamine and Culgoa Rivers in Qld & NSW (Toowoomba)
Basin 420 & 421 = Castlereagh, Macquarie and Bogan Rivers (Orange, Dubbo, Bathurst)
Basin 423 & 424 = Warrego and Paroo Rivers (Charleville)
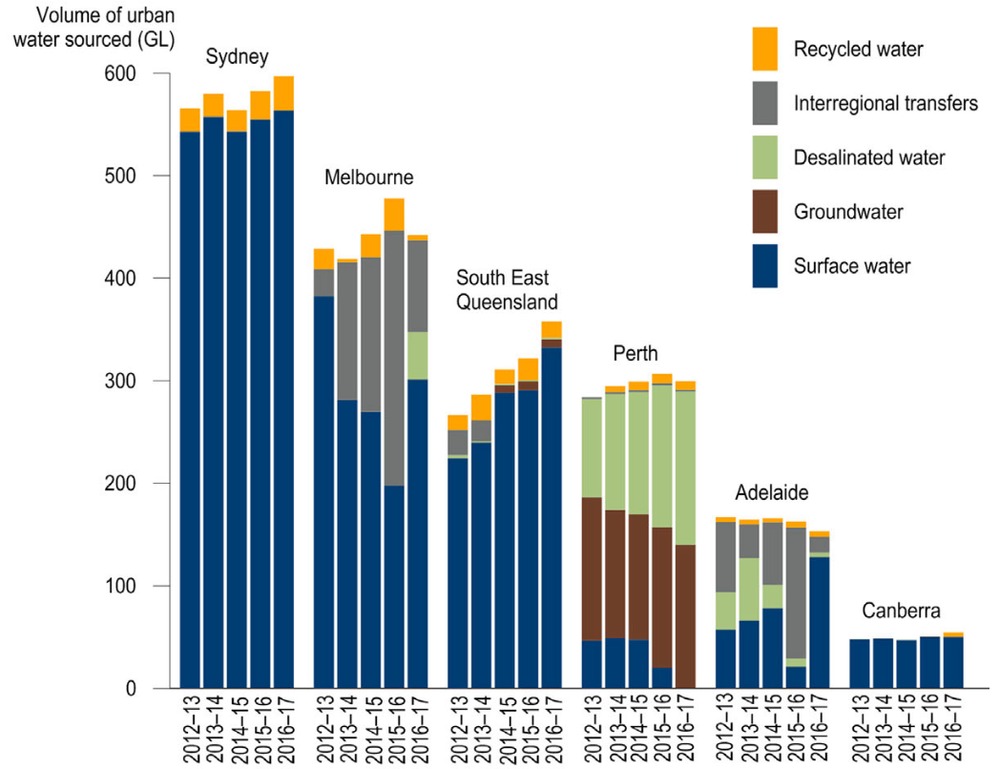
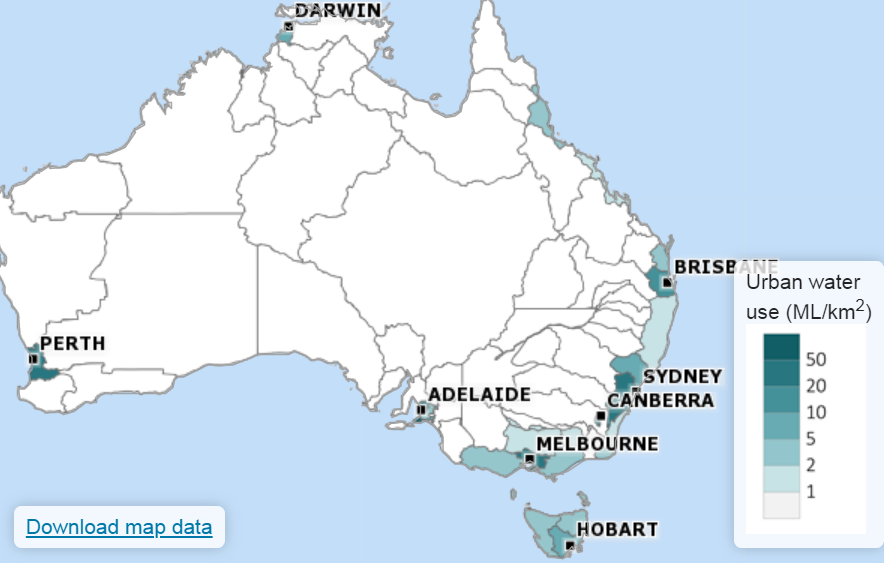
Information is given in the report for 1977 total and per capita usage, domestic, commercial, industrial and other usages in the cities of
Sydney + Wollongong, Melbourne, Brisbane, Adelaide, Perth, Newcastle, Canberra
“Other usage” includes water leaks and fire-fighting
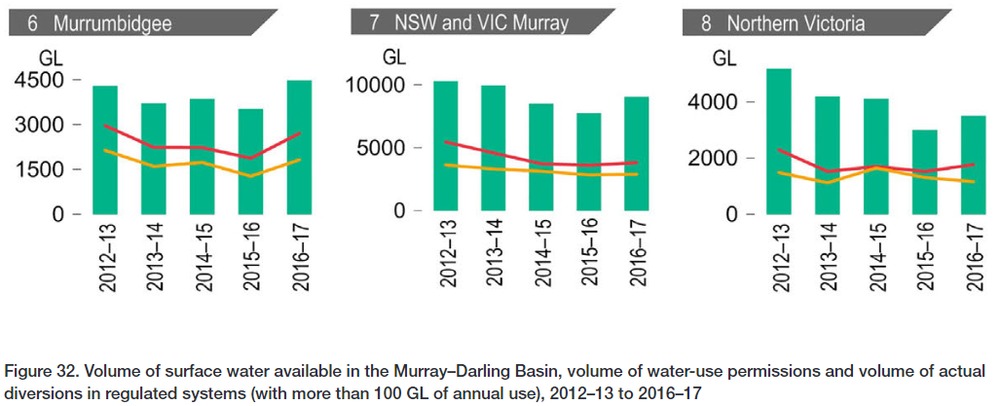
Comparison of water supply to water use. Murray-Darling in 1977
Surface Water use 11,000 gigalitres = 60%
Surface Water available 18,372 gigalitres
Storage evaporation losses 1,184 gigalitres
Groundwater use 778 gigalitres = 39%
Groundwater estimated annual recharge = 2002 gigalitres