Date: 24/09/2020 20:56:48
From: The Rev Dodgson
ID: 1623586
Subject: Spherical Geometry
For Moll, and anyone else who might be interested:
I have set up a spreadsheet to use Vincenty’s Formula to find the distance between two points, as described here:
https://en.wikipedia.org/wiki/Vincenty%27s_formulae
then using that to find the area enclosed by a series of points, as described here:
https://en.wikipedia.org/wiki/Spherical_trigonometry#Area_and_spherical_excess
For each calculation there is an on-sheet example, and a VBA user defined function giving the same results.
The spreadsheet can be found at:
http://interactiveds.com.au/software/VinCenty.xlsb
Any questions or comments, let me know.
Date: 24/09/2020 21:23:32
From: Witty Rejoinder
ID: 1623602
Subject: re: Spherical Geometry
The Rev Dodgson said:
Any questions or comments, let me know.
How long have you identified as an uber-nerd?
:-P
Date: 24/09/2020 21:25:13
From: The Rev Dodgson
ID: 1623604
Subject: re: Spherical Geometry
Witty Rejoinder said:
The Rev Dodgson said:
Any questions or comments, let me know.
How long have you identified as an uber-nerd?
:-P
Don’t know what you are talking about.
I still use proper taxis.
Date: 24/09/2020 21:26:06
From: sibeen
ID: 1623605
Subject: re: Spherical Geometry
The Rev Dodgson said:
Witty Rejoinder said:
The Rev Dodgson said:
Any questions or comments, let me know.
How long have you identified as an uber-nerd?
:-P
Don’t know what you are talking about.
I still use proper taxis.
ROFL
Date: 24/09/2020 21:31:29
From: Witty Rejoinder
ID: 1623610
Subject: re: Spherical Geometry
The Rev Dodgson said:
Witty Rejoinder said:
The Rev Dodgson said:
Any questions or comments, let me know.
How long have you identified as an uber-nerd?
:-P
Don’t know what you are talking about.
I still use proper taxis.
Hoist with mine own petard.
Date: 24/09/2020 22:39:36
From: mollwollfumble
ID: 1623632
Subject: re: Spherical Geometry
The Rev Dodgson said:
For Moll, and anyone else who might be interested:
I have set up a spreadsheet to use Vincenty’s Formula to find the distance between two points, as described here:
https://en.wikipedia.org/wiki/Vincenty%27s_formulae
then using that to find the area enclosed by a series of points, as described here:
https://en.wikipedia.org/wiki/Spherical_trigonometry#Area_and_spherical_excess
For each calculation there is an on-sheet example, and a VBA user defined function giving the same results.
The spreadsheet can be found at:
http://interactiveds.com.au/software/VinCenty.xlsb
Any questions or comments, let me know.
Yes please. I’m struggling right now with two problems. One is the area of a small quadrilateral on the sphere when the quadrilateral contains the north pole. Away from the pole, the area is approximated by delta lambda * delta phi * cos phi, but that formula fails miserably as phi approaches 90 degrees.
The other struggle is taking a great circle line and finding a point further along that line. eg. suppose I have two points (lambda0,phi0) and (lambda1,phi1) and have calculated distance ‘d’ along a great circle between them. Find the point a distance 1.1*d from point (lambda0,phi0) along that great circle.
Will look at your spreadsheet very soon. Goodnight for now.
Date: 25/09/2020 09:25:23
From: The Rev Dodgson
ID: 1623762
Subject: re: Spherical Geometry
mollwollfumble said:
The Rev Dodgson said:
For Moll, and anyone else who might be interested:
I have set up a spreadsheet to use Vincenty’s Formula to find the distance between two points, as described here:
https://en.wikipedia.org/wiki/Vincenty%27s_formulae
then using that to find the area enclosed by a series of points, as described here:
https://en.wikipedia.org/wiki/Spherical_trigonometry#Area_and_spherical_excess
For each calculation there is an on-sheet example, and a VBA user defined function giving the same results.
The spreadsheet can be found at:
http://interactiveds.com.au/software/VinCenty.xlsb
Any questions or comments, let me know.
Yes please. I’m struggling right now with two problems. One is the area of a small quadrilateral on the sphere when the quadrilateral contains the north pole. Away from the pole, the area is approximated by delta lambda * delta phi * cos phi, but that formula fails miserably as phi approaches 90 degrees.
The other struggle is taking a great circle line and finding a point further along that line. eg. suppose I have two points (lambda0,phi0) and (lambda1,phi1) and have calculated distance ‘d’ along a great circle between them. Find the point a distance 1.1*d from point (lambda0,phi0) along that great circle.
Will look at your spreadsheet very soon. Goodnight for now.
I think the extended line calculation is included in the Wikipedia link. I’ll have a look at adding that to the spreadsheet.
On the Cos phi problem, this post from my blog may (or may not) have a fix:
https://newtonexcelbach.com/2013/01/12/the-angle-between-two-vectors-in-2d-or-3d/
I’ll have a look at that as well.
Date: 25/09/2020 09:28:18
From: Tamb
ID: 1623768
Subject: re: Spherical Geometry
The Rev Dodgson said:
mollwollfumble said:
The Rev Dodgson said:
For Moll, and anyone else who might be interested:
I have set up a spreadsheet to use Vincenty’s Formula to find the distance between two points, as described here:
https://en.wikipedia.org/wiki/Vincenty%27s_formulae
then using that to find the area enclosed by a series of points, as described here:
https://en.wikipedia.org/wiki/Spherical_trigonometry#Area_and_spherical_excess
For each calculation there is an on-sheet example, and a VBA user defined function giving the same results.
The spreadsheet can be found at:
http://interactiveds.com.au/software/VinCenty.xlsb
Any questions or comments, let me know.
Yes please. I’m struggling right now with two problems. One is the area of a small quadrilateral on the sphere when the quadrilateral contains the north pole. Away from the pole, the area is approximated by delta lambda * delta phi * cos phi, but that formula fails miserably as phi approaches 90 degrees.
The other struggle is taking a great circle line and finding a point further along that line. eg. suppose I have two points (lambda0,phi0) and (lambda1,phi1) and have calculated distance ‘d’ along a great circle between them. Find the point a distance 1.1*d from point (lambda0,phi0) along that great circle.
Will look at your spreadsheet very soon. Goodnight for now.
I think the extended line calculation is included in the Wikipedia link. I’ll have a look at adding that to the spreadsheet.
On the Cos phi problem, this post from my blog may (or may not) have a fix:
https://newtonexcelbach.com/2013/01/12/the-angle-between-two-vectors-in-2d-or-3d/
I’ll have a look at that as well.
Have not done any spherical geometry for over 50 years so I think I’ll pass thanks.
Date: 25/09/2020 12:03:21
From: captain_spalding
ID: 1623844
Subject: re: Spherical Geometry
Tamb said:
Have not done any spherical geometry for over 50 years so I think I’ll pass thanks.
I’m as rusty as the wreck of the Titanic, so i can’t offer anything.
It made my head hurt way back then. I see no need to suffer again.
Date: 25/09/2020 12:16:49
From: captain_spalding
ID: 1623851
Subject: re: Spherical Geometry
Date: 25/09/2020 19:40:56
From: mollwollfumble
ID: 1624120
Subject: re: Spherical Geometry
The Rev Dodgson said:
mollwollfumble said:
The Rev Dodgson said:
For Moll, and anyone else who might be interested:
I have set up a spreadsheet to use Vincenty’s Formula to find the distance between two points, as described here:
https://en.wikipedia.org/wiki/Vincenty%27s_formulae
then using that to find the area enclosed by a series of points, as described here:
https://en.wikipedia.org/wiki/Spherical_trigonometry#Area_and_spherical_excess
For each calculation there is an on-sheet example, and a VBA user defined function giving the same results.
The spreadsheet can be found at:
http://interactiveds.com.au/software/VinCenty.xlsb
Any questions or comments, let me know.
Yes please. I’m struggling right now with two problems. One is the area of a small quadrilateral on the sphere when the quadrilateral contains the north pole. Away from the pole, the area is approximated by delta lambda * delta phi * cos phi, but that formula fails miserably as phi approaches 90 degrees.
The other struggle is taking a great circle line and finding a point further along that line. eg. suppose I have two points (lambda0,phi0) and (lambda1,phi1) and have calculated distance ‘d’ along a great circle between them. Find the point a distance 1.1*d from point (lambda0,phi0) along that great circle.
Will look at your spreadsheet very soon. Goodnight for now.
I think the extended line calculation is included in the Wikipedia link. I’ll have a look at adding that to the spreadsheet.
On the Cos phi problem, this post from my blog may (or may not) have a fix:
https://newtonexcelbach.com/2013/01/12/the-angle-between-two-vectors-in-2d-or-3d/
I’ll have a look at that as well.
Hi there, I’ve downloaded it now and am starting to understand it.
On the cos phi problem. Yes, you have the fix. Using angle excess is the way to do it.
On the extended line, yes it is on your wikipedia link. ie. https://en.wikipedia.org/wiki/Vincenty%27s_formulae#Direct_problem
Thanks. They will both come in handy in the programs I’m now debugging for finding the best map projection in a rectangle.
On another Excel topic, would you happen to know if there’s a way to draw a filled polygon given the coordinates of the corners in Excel? A fill colour for a polygon like this.

Date: 27/09/2020 13:53:05
From: The Rev Dodgson
ID: 1624864
Subject: re: Spherical Geometry
Question for moll:
What is your best estimate of the area of mainland Australia? I’m finding huge differences in reported values on the Internet.
My VBA function is giving:
7592812.123 km2
I’ll post an updated spreadsheet later today.
On the polygon fill question, you can’t do it with a scatter chart (afaIk) but you can plot polygon shapes from coordinates with VBA. I’ll post a link on that too.
Date: 27/09/2020 15:51:00
From: mollwollfumble
ID: 1624924
Subject: re: Spherical Geometry
The Rev Dodgson said:
Question for moll:
What is your best estimate of the area of mainland Australia? I’m finding huge differences in reported values on the Internet.
My VBA function is giving:
7592812.123 km2
I’ll post an updated spreadsheet later today.
On the polygon fill question, you can’t do it with a scatter chart (afaIk) but you can plot polygon shapes from coordinates with VBA. I’ll post a link on that too.
Area of Australia. Hmm.
Methinks with or without islands, let’s say with. With or without ocean territories, let’s say without.
I should be able to get two answers for the land area straight from the spreadsheet I have because I have two datasets of Australia, one from the coast database (low resolution) and one from the database of countries (high resolution). The low res version does have the islands but I have to calculate and add them separately. The country database has most islands together, but some island groups separate.
But first check web. In km^2.
7,692,000 from Google.
7,617,930 from wikipedia
8,148,250 from wikipedia for Exclusive Economic Zone (ie. including ocean)
68,401 for Tasmania from wikipedia
64,519 for Tasmania main island from wikipedia
7,595,342 Australia mainland from Google. That’s within spitting distance of your VBA 7,592,812
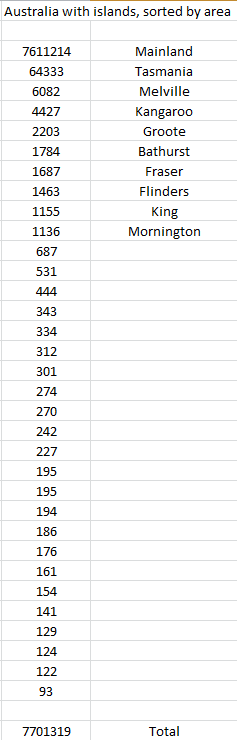
Australia’s islands, from wikipedia. The islands larger than 1,000 square kilometres are:
- Tasmania, 64,519
- Melville Island, 5,786
- Kangaroo Island, 4,416
- Groote Eylandt, 2,285
- Bathurst Island, 1,693
- Fraser Island, 1,653
- Flinders Island, 1,359
- King Island, 1,091
- Mornington Island, 1,002
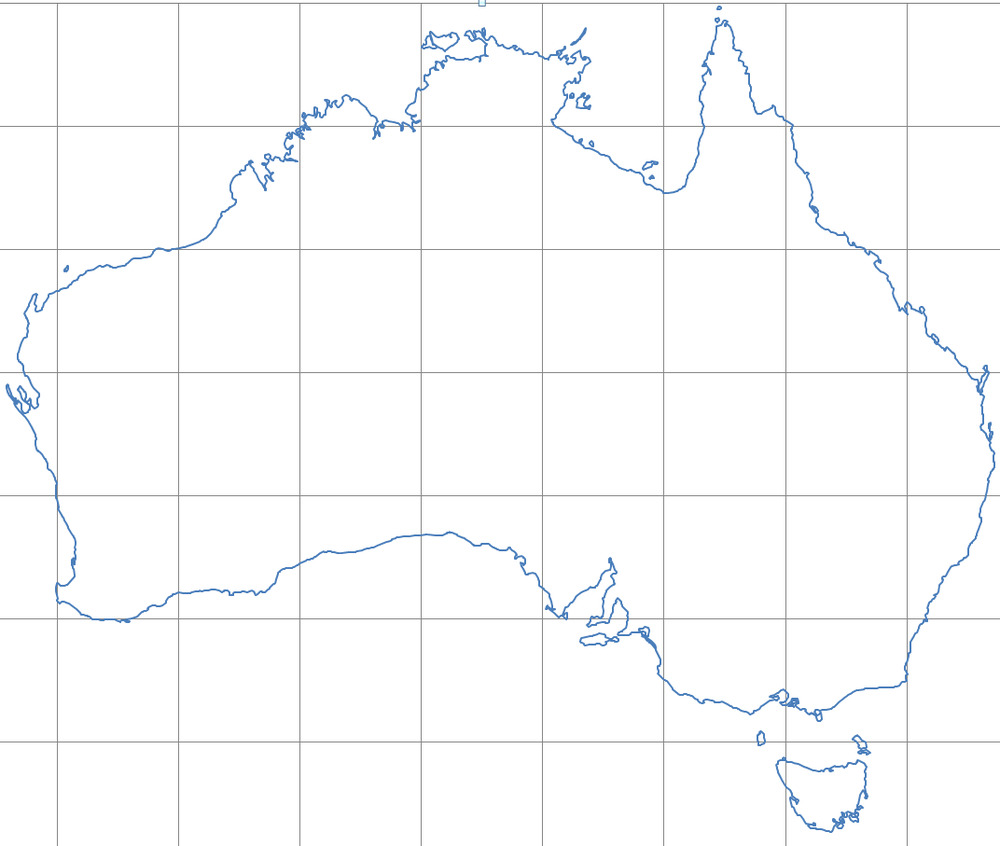
OK, so using the following as my model of Australia (map projection just latitude-longitude). It includes largest islands but misses Cocos-Keeling, Macquarie, Heard Island, misses most of the islands of the barrier reef and isn’t too accurate for Torres Strait, NT and Tasmanian islands. It also excludes the Coorong. It does include Phillip and French Islands in Westernport. Stay tuned for results.
Date: 27/09/2020 17:05:40
From: mollwollfumble
ID: 1624970
Subject: re: Spherical Geometry
mollwollfumble said:
The Rev Dodgson said:
Question for moll:
What is your best estimate of the area of mainland Australia? I’m finding huge differences in reported values on the Internet.
My VBA function is giving:
7592812.123 km2
I’ll post an updated spreadsheet later today.
On the polygon fill question, you can’t do it with a scatter chart (afaIk) but you can plot polygon shapes from coordinates with VBA. I’ll post a link on that too.
Area of Australia. Hmm.
Methinks with or without islands, let’s say with. With or without ocean territories, let’s say without.
I should be able to get two answers for the land area straight from the spreadsheet I have because I have two datasets of Australia, one from the coast database (low resolution) and one from the database of countries (high resolution). The low res version does have the islands but I have to calculate and add them separately. The country database has most islands together, but some island groups separate.
But first check web. In km^2.
7,692,000 from Google.
7,617,930 from wikipedia
8,148,250 from wikipedia for Exclusive Economic Zone (ie. including ocean)
68,401 for Tasmania from wikipedia
64,519 for Tasmania main island from wikipedia
7,595,342 Australia mainland from Google. That’s within spitting distance of your VBA 7,592,812
Australia’s islands, from wikipedia. The islands larger than 1,000 square kilometres are:
- Tasmania, 64,519
- Melville Island, 5,786
- Kangaroo Island, 4,416
- Groote Eylandt, 2,285
- Bathurst Island, 1,693
- Fraser Island, 1,653
- Flinders Island, 1,359
- King Island, 1,091
- Mornington Island, 1,002
OK, so using the following as my model of Australia (map projection just latitude-longitude). It includes largest islands but misses Cocos-Keeling, Macquarie, Heard Island, misses most of the islands of the barrier reef and isn’t too accurate for Torres Strait, NT and Tasmanian islands. It also excludes the Coorong. It does include Phillip and French Islands in Westernport. Stay tuned for results.
This is what I get. Using 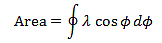
> 7,617,930 from wikipedia
Hold on, Wikipedia gives two values on the same web page. The second is 7,692,024. Use the second one.
Or to put it another way, I’m getting a 0.21% error in the area of the Australian mainland and a 0.12% error for the whole of Australia.
Date: 27/09/2020 17:16:00
From: mollwollfumble
ID: 1624979
Subject: re: Spherical Geometry
>> 7,617,930 from wikipedia
> Hold on, Wikipedia gives two values on the same web page. The second is 7,692,024. Use the second one.
I just fixed wikipedia, changing the 7,617,930 to 7,692,024.
Date: 27/09/2020 18:32:29
From: The Rev Dodgson
ID: 1625013
Subject: re: Spherical Geometry
mollwollfumble said:
>> 7,617,930 from wikipedia
> Hold on, Wikipedia gives two values on the same web page. The second is 7,692,024. Use the second one.
I just fixed wikipedia, changing the 7,617,930 to 7,692,024.
Why do you think tat one is right?
Why do you think either are right for that matter?
Date: 27/09/2020 18:34:30
From: Peak Warming Man
ID: 1625015
Subject: re: Spherical Geometry
The Rev Dodgson said:
mollwollfumble said:
>> 7,617,930 from wikipedia
> Hold on, Wikipedia gives two values on the same web page. The second is 7,692,024. Use the second one.
I just fixed wikipedia, changing the 7,617,930 to 7,692,024.
Why do you think tat one is right?
Why do you think either are right for that matter?
Wiki might have been allowing for sea level rise, might have applied some global warming factor.
Date: 27/09/2020 18:40:11
From: dv
ID: 1625019
Subject: re: Spherical Geometry
You’ve updated the value in the WP lede, but now it doesn’t match the inline reference, which is to a Geoscience Australia page which gives 7617930 km^2 as Australia’s area. Rather than making ad hoc edits it might be better if you investigate the references for the competing estimates.
If you do decide that the evidence for 7692024 km^2 is stronger, please change in the inline reference so that it points to a respectable page that provides that estimate.
Date: 27/09/2020 19:07:57
From: mollwollfumble
ID: 1625051
Subject: re: Spherical Geometry
dv said:
You’ve updated the value in the WP lede, but now it doesn’t match the inline reference, which is to a Geoscience Australia page which gives 7617930 km^2 as Australia’s area. Rather than making ad hoc edits it might be better if you investigate the references for the competing estimates.
If you do decide that the evidence for 7692024 km^2 is stronger, please change in the inline reference so that it points to a respectable page that provides that estimate.
I noticed. I though I’d leave that for the next editor.
The smaller one is missing Tasmania.
Date: 27/09/2020 21:29:41
From: The Rev Dodgson
ID: 1625125
Subject: re: Spherical Geometry
This link:
http://www.ga.gov.au/scientific-topics/national-location-information/dimensions/area-of-australia-states-and-territories
gives areas for each state, with and without islands, and gives a total mainland area of 7,591,608 km2, which compares pretty well with my number of 7,592,812 km2.
Date: 27/09/2020 22:17:44
From: mollwollfumble
ID: 1625132
Subject: re: Spherical Geometry
The Rev Dodgson said:
This link:
http://www.ga.gov.au/scientific-topics/national-location-information/dimensions/area-of-australia-states-and-territories
gives areas for each state, with and without islands, and gives a total mainland area of 7,591,608 km2, which compares pretty well with my number of 7,592,812 km2.
> gives a total mainland area of 7,591,608 km2, which compares pretty well with my number of 7,592,812 km2
That’s what I thought, mainland.
Google gives Australian mainland as 7,595,342. Also in the same ballpark.
I get a less accurate 7,611,214 integrating longitude*cos(latitude) on a sphere.
Date: 27/09/2020 22:57:22
From: The Rev Dodgson
ID: 1625136
Subject: re: Spherical Geometry
See:
Spherical Geometry and Vincenty’s Formulae
for a link to the updated spreadsheet, including the calculation of the Australian area.
Date: 28/09/2020 15:36:25
From: The Rev Dodgson
ID: 1625440
Subject: re: Spherical Geometry
To my surprise, plotting complex filled shapes in Excel actually works pretty well:
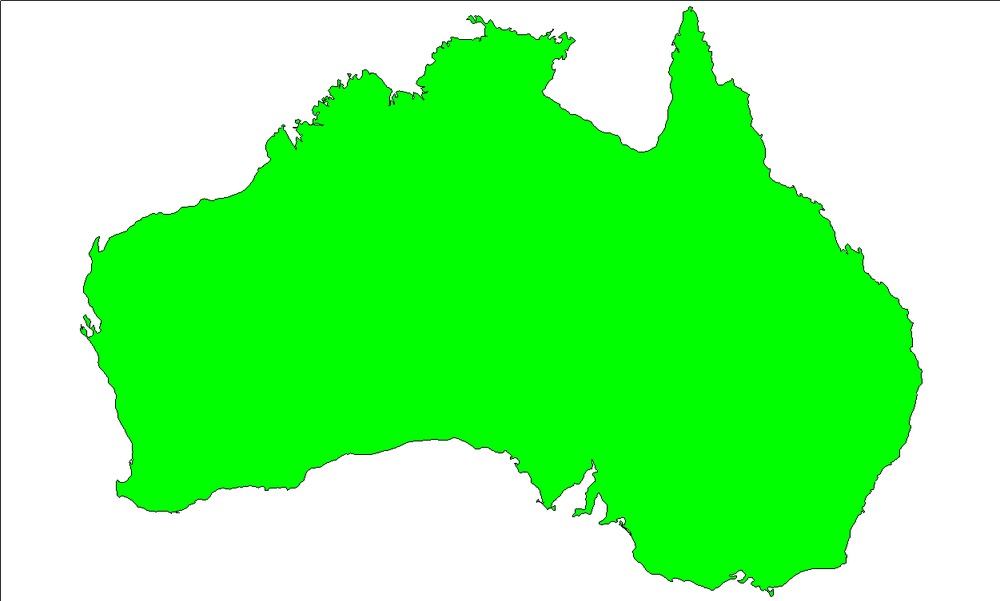
The spreadsheet is at:
http://interactiveds.com.au/software/Plotxy-oz.xlsb
To change the colour enter a different number in cell G4 on the Oz sheet. You can also change the transparency. Then click Redraw.
To plot a different area paste in the node number and coordinates list as a three column range, and the list of node numbers defining the shape in a row (or rows for more than one shape). Click draw and reselect the ranges.
It’s set up to draw multiple simple shapes, that may not have sequential node numbers, but I’ll modify it to have the option of just entering the first and last node number (when I have time).
Date: 28/09/2020 15:57:35
From: mollwollfumble
ID: 1625450
Subject: re: Spherical Geometry
The Rev Dodgson said:
To my surprise, plotting complex filled shapes in Excel actually works pretty well:
The spreadsheet is at:
http://interactiveds.com.au/software/Plotxy-oz.xlsb
To change the colour enter a different number in cell G4 on the Oz sheet. You can also change the transparency. Then click Redraw.
To plot a different area paste in the node number and coordinates list as a three column range, and the list of node numbers defining the shape in a row (or rows for more than one shape). Click draw and reselect the ranges.
It’s set up to draw multiple simple shapes, that may not have sequential node numbers, but I’ll modify it to have the option of just entering the first and last node number (when I have time).
Clap clap clap clap clap clap clap.
OK, now that’s officially weird.
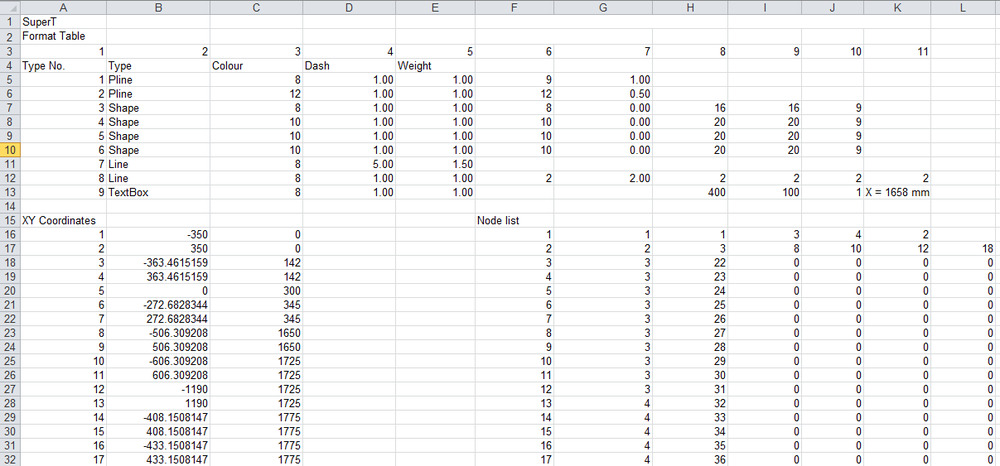
The following is getting a bit confusing. What’s going on here?
Date: 28/09/2020 16:38:50
From: The Rev Dodgson
ID: 1625459
Subject: re: Spherical Geometry
mollwollfumble said:
OK, now that’s officially weird.
I renumbered the nodes when I was working on the areas, so I could divide it into two shapes, and I forgot to renumber it. Since the plot works it looks like it uses the sequence number rather than the numbers in the column anyway. I’ll check the code.
The following is getting a bit confusing. What’s going on here?
mollwollfumble said:
That’s the format table for plotting a different set of shapes (cross section of a SuperT precast beam). The FormatTable sheet has a table listing what each column controls. The Australia plot uses the table on the Oz sheet, and only uses the first line, because there is only one shape.
Date: 28/09/2020 16:45:34
From: The Rev Dodgson
ID: 1625460
Subject: re: Spherical Geometry
Some blog posts on plotting shapes in Excel using VBA can be found at:
https://newtonexcelbach.com/2012/09/24/daily-download-8-drawing-in-excel/
Date: 28/09/2020 16:58:44
From: The Rev Dodgson
ID: 1625462
Subject: re: Spherical Geometry
The Rev Dodgson said:
Since the plot works it looks like it uses the sequence number rather than the numbers in the column anyway. I’ll check the code.
Yes, the node numbers in the first column of the list of coordinates don’t actually do anything.
Date: 28/09/2020 17:39:01
From: mollwollfumble
ID: 1625466
Subject: re: Spherical Geometry
The Rev Dodgson said:
The Rev Dodgson said:
Since the plot works it looks like it uses the sequence number rather than the numbers in the column anyway. I’ll check the code.
Yes, the node numbers in the first column of the list of coordinates don’t actually do anything.
Good. I was hoping that that was the case.
Date: 28/09/2020 18:32:33
From: mollwollfumble
ID: 1625487
Subject: re: Spherical Geometry
The Rev Dodgson said:
To my surprise, plotting complex filled shapes in Excel actually works pretty well:
The spreadsheet is at:
http://interactiveds.com.au/software/Plotxy-oz.xlsb
To change the colour enter a different number in cell G4 on the Oz sheet. You can also change the transparency. Then click Redraw.
To plot a different area paste in the node number and coordinates list as a three column range, and the list of node numbers defining the shape in a row (or rows for more than one shape). Click draw and reselect the ranges.
It’s set up to draw multiple simple shapes, that may not have sequential node numbers, but I’ll modify it to have the option of just entering the first and last node number (when I have time).
And here is the Australian mainland in Lambert Azimuthal Equal Area Projection.

Date: 28/09/2020 19:12:59
From: The Rev Dodgson
ID: 1625501
Subject: re: Spherical Geometry
mollwollfumble said:
The Rev Dodgson said:
To my surprise, plotting complex filled shapes in Excel actually works pretty well:
The spreadsheet is at:
http://interactiveds.com.au/software/Plotxy-oz.xlsb
To change the colour enter a different number in cell G4 on the Oz sheet. You can also change the transparency. Then click Redraw.
To plot a different area paste in the node number and coordinates list as a three column range, and the list of node numbers defining the shape in a row (or rows for more than one shape). Click draw and reselect the ranges.
It’s set up to draw multiple simple shapes, that may not have sequential node numbers, but I’ll modify it to have the option of just entering the first and last node number (when I have time).
And here is the Australian mainland in Lambert Azimuthal Equal Area Projection.
Glad it worked :)
Date: 29/09/2020 21:06:36
From: mollwollfumble
ID: 1625940
Subject: re: Spherical Geometry
The Rev Dodgson said:
mollwollfumble said:
The Rev Dodgson said:
To my surprise, plotting complex filled shapes in Excel actually works pretty well:
The spreadsheet is at:
http://interactiveds.com.au/software/Plotxy-oz.xlsb
To change the colour enter a different number in cell G4 on the Oz sheet. You can also change the transparency. Then click Redraw.
To plot a different area paste in the node number and coordinates list as a three column range, and the list of node numbers defining the shape in a row (or rows for more than one shape). Click draw and reselect the ranges.
It’s set up to draw multiple simple shapes, that may not have sequential node numbers, but I’ll modify it to have the option of just entering the first and last node number (when I have time).
And here is the Australian mainland in Lambert Azimuthal Equal Area Projection.
Glad it worked :)
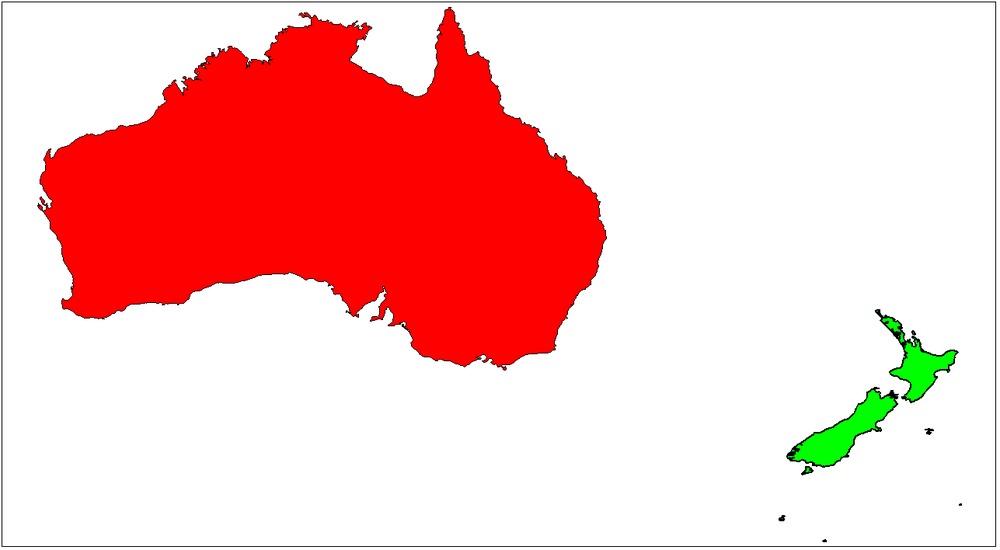
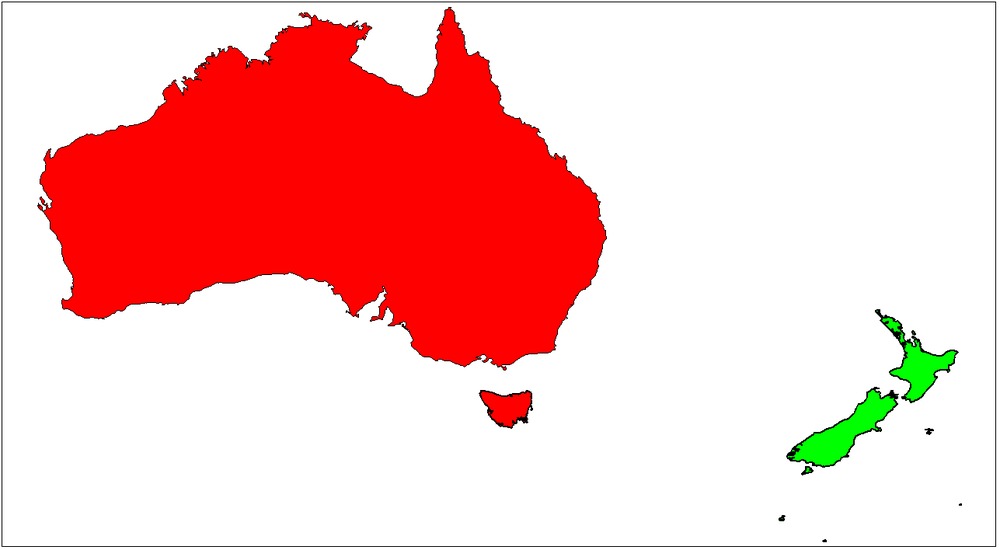
I still haven’t figured out how to plot two places on the same chart. eg. NZ + Australia.
Date: 29/09/2020 21:57:07
From: The Rev Dodgson
ID: 1625954
Subject: re: Spherical Geometry
mollwollfumble said:
The Rev Dodgson said:
mollwollfumble said:
And here is the Australian mainland in Lambert Azimuthal Equal Area Projection.
Glad it worked :)
I still haven’t figured out how to plot two places on the same chart. eg. NZ + Australia.
That’s easy; just include the coordinates for the two places in a continuous list, then add another row to the node numbers list.
I have now modified the code for the node numbers so you can enter the start and and of a continuous range, rather then listing every number.
So if Australia was nodes 1-2900 and NZ 2901-4000 then the node number definition would be:
No Type Node1 Node2
1 1 1 - 2900
2 1 2901 – 4000
Then click the Draw button, rather than redraw, and select the whole coordinates range, and both rows for the node list.
Or give me a link for NZ coordinates and I’ll post an example.
(I’m going to upload the revised spreadsheet to the same address as before now, so allow 5 minutes before downloading)
Date: 30/09/2020 11:14:12
From: mollwollfumble
ID: 1626095
Subject: re: Spherical Geometry
The Rev Dodgson said:
mollwollfumble said:
The Rev Dodgson said:
Glad it worked :)
I still haven’t figured out how to plot two places on the same chart. eg. NZ + Australia.
That’s easy; just include the coordinates for the two places in a continuous list, then add another row to the node numbers list.
I have now modified the code for the node numbers so you can enter the start and and of a continuous range, rather then listing every number.
So if Australia was nodes 1-2900 and NZ 2901-4000 then the node number definition would be:
No Type Node1 Node2
1 1 1 - 2900
2 1 2901 – 4000
Then click the Draw button, rather than redraw, and select the whole coordinates range, and both rows for the node list.
Or give me a link for NZ coordinates and I’ll post an example.
(I’m going to upload the revised spreadsheet to the same address as before now, so allow 5 minutes before downloading)
Have downloaded.
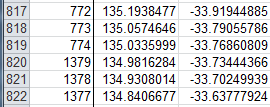
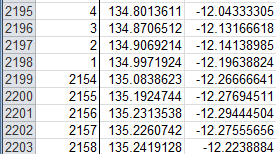
The file containing (almost) all my world coordinates is the one linked below. For New Zealand go to page “All” and look right for the column headed New Zealand.
The coordinates for the world that I use are on pages:
“All” – all country boundaries but missing most of Canada, important parts of Russia, and parts of Greenland and Antarctica.
“Extras” – extra country boundaries for Canada and Russia
“CoastSea” – Lower resolution, I use this for polar regions, in particular the islands of Canada, Russia and all of Greenland, and Svalbard.
On other pages, if the page name ends in ‘2’, I’ve removed smaller islands before applying a map projection, in order to avoid enough work to keep me same. The plot “ChCanada” looks impressive but is seriously incomplete.
https://drive.google.com/file/d/1E4snFoCS3xeAigSC_tbsRnagQGzEG9Oi/view?usp=sharing
Date: 30/09/2020 11:38:39
From: The Rev Dodgson
ID: 1626116
Subject: re: Spherical Geometry
Thanks:
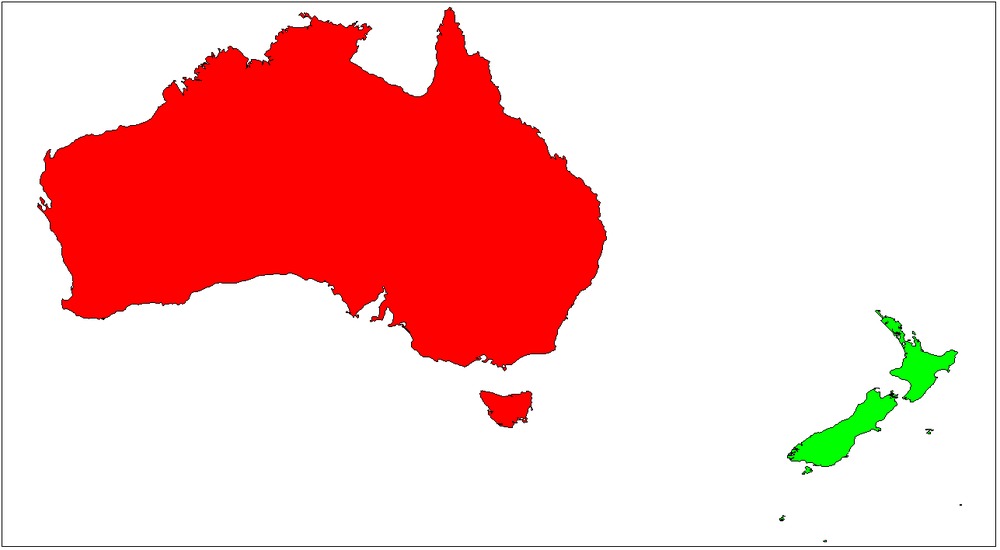
One of the islands for NZ had negative Longitude values. I just multiplied them by -1.
Date: 30/09/2020 11:41:17
From: mollwollfumble
ID: 1626118
Subject: re: Spherical Geometry
The Rev Dodgson said:
Thanks:
One of the islands for NZ had negative Longitude values. I just multiplied them by -1.
Nice!
Date: 30/09/2020 11:44:54
From: Ian
ID: 1626119
Subject: re: Spherical Geometry
The Rev Dodgson said:
Thanks:
One of the islands for NZ had negative Longitude values. I just multiplied them by -1.
I notice you’ve deleted Tasmania.
Oh well…
Date: 30/09/2020 11:46:20
From: The Rev Dodgson
ID: 1626120
Subject: re: Spherical Geometry
mollwollfumble said:
The Rev Dodgson said:
Thanks:
One of the islands for NZ had negative Longitude values. I just multiplied them by -1.
Nice!
Thanks. I’ll copy that one to the download link.
I was quite surprised by how fast it plots these complex shapes. I have previously used it for plotting a few hundred very simple shapes, and that’s very slow. There must be something slow in the plot routine that is triggered for every separate shape.
Date: 30/09/2020 11:47:58
From: The Rev Dodgson
ID: 1626121
Subject: re: Spherical Geometry
Ian said:
The Rev Dodgson said:
Thanks:
One of the islands for NZ had negative Longitude values. I just multiplied them by -1.
I notice you’ve deleted Tasmania.
Oh well…
Not so much deleted as failed to recognise it’s existence. :)
Now moll has given me coords for the whole planet I guess I should add it in.
Date: 30/09/2020 11:53:29
From: The Rev Dodgson
ID: 1626124
Subject: re: Spherical Geometry
Tasmania now recognised:
Date: 30/09/2020 13:24:55
From: The Rev Dodgson
ID: 1626187
Subject: re: Spherical Geometry
Code modified so the line weight for shapes after the first plot correctly:
Date: 5/10/2020 19:28:35
From: mollwollfumble
ID: 1628628
Subject: re: Spherical Geometry
The Rev Dodgson said:
Code modified so the line weight for shapes after the first plot correctly:
Excellent! :-)
Hold on, where’s that link again … searches back … ah, here we go. http://interactiveds.com.au/software/Plotxy-oz.xlsb
Beautiful. I have it now.
(delay in downloading was because of my minor mental and physical breakdown – over it now)
Date: 5/10/2020 19:31:09
From: captain_spalding
ID: 1628630
Subject: re: Spherical Geometry
mollwollfumble said:
…my minor mental and physical breakdown…
I’m a bit slow about these things. Doesn’t mean i’m not concerned. ‘M&P breakdown’.
You ok, hun?
Date: 5/10/2020 19:39:51
From: mollwollfumble
ID: 1628638
Subject: re: Spherical Geometry
captain_spalding said:
mollwollfumble said:
…my minor mental and physical breakdown…
I’m a bit slow about these things. Doesn’t mean i’m not concerned. ‘M&P breakdown’.
You ok, hun?
Pretty well. Overdid things putting the new garage door in in a hurry. That door was too heavy for me to lift. The physical and mental effort wiped me out for about four days. Now my only remaining problems left are a sleep-wake cycle of about 4 hours, and general bodily tiredness. I’ve decided not to put a new front fence in all by myself.
Date: 5/10/2020 19:41:32
From: captain_spalding
ID: 1628641
Subject: re: Spherical Geometry
mollwollfumble said:
captain_spalding said:
mollwollfumble said:
…my minor mental and physical breakdown…
I’m a bit slow about these things. Doesn’t mean i’m not concerned. ‘M&P breakdown’.
You ok, hun?
Pretty well. Overdid things putting the new garage door in in a hurry. That door was too heavy for me to lift. The physical and mental effort wiped me out for about four days. Now my only remaining problems left are a sleep-wake cycle of about 4 hours, and general bodily tiredness. I’ve decided not to put a new front fence in all by myself.
Ol’ Doc Spalding prescribes brandy, good brandy.
But then, ol’ Doc Spalding prescribes that for everything.
Date: 5/10/2020 21:49:24
From: The Rev Dodgson
ID: 1628742
Subject: re: Spherical Geometry
mollwollfumble said:
The Rev Dodgson said:
Code modified so the line weight for shapes after the first plot correctly:
Excellent! :-)
Hold on, where’s that link again … searches back … ah, here we go. http://interactiveds.com.au/software/Plotxy-oz.xlsb
Beautiful. I have it now.
(delay in downloading was because of my minor mental and physical breakdown – over it now)
Glad you are feeling better.
Any plans for more work on the maps?
Date: 5/10/2020 22:06:12
From: mollwollfumble
ID: 1628753
Subject: re: Spherical Geometry
The Rev Dodgson said:
mollwollfumble said:
The Rev Dodgson said:
Code modified so the line weight for shapes after the first plot correctly:
Excellent! :-)
Hold on, where’s that link again … searches back … ah, here we go. http://interactiveds.com.au/software/Plotxy-oz.xlsb
Beautiful. I have it now.
(delay in downloading was because of my minor mental and physical breakdown – over it now)
Glad you are feeling better.
Any plans for more work on the maps?
Yep. I want to set it up so I can plot world covid statistics on maps. And other information available on a country by country basis.
I’ve given up on “best equal area in rectangle”. For some reason my algorithm is crashing without warning in the middle of Powell optimisation.
I still want to make a good world map for the seven seas. I’m not sure how, perhaps by ensuring continuity at the southern tips of Africa and Tasmania. (I had in mind a variant on the Bonne projection for this, but I’m now pretty sure that that won’t work).
And I’d like to make a world map of islands – no continents, just islands. I’ve sort of made a start for islands of the South Pacific, but I want to do better.
Date: 8/10/2020 06:03:57
From: mollwollfumble
ID: 1629719
Subject: re: Spherical Geometry
The Rev Dodgson said:
Code modified so the line weight for shapes after the first plot correctly:
The world map is starting to come together. It’s a bit of a slow process. Fingers crossed, when I have it finished all I’ll have to change to plot different variables will be the transparency.
Date: 8/10/2020 16:33:41
From: mollwollfumble
ID: 1630111
Subject: re: Spherical Geometry
mollwollfumble said:
The Rev Dodgson said:
Code modified so the line weight for shapes after the first plot correctly:
The world map is starting to come together. It’s a bit of a slow process. Fingers crossed, when I have it finished all I’ll have to change to plot different variables will be the transparency.
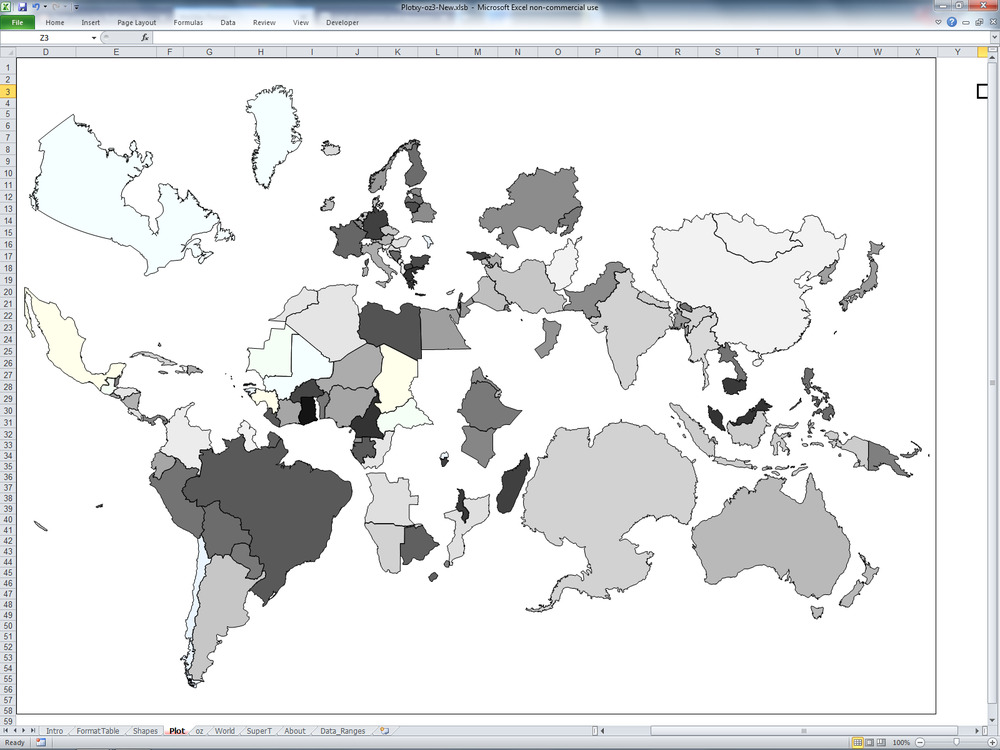
A few more countries now. Up the alphabet scale to Indonesia. A couple of errors (wrong shape for Fiji for starters) but so far so good.
Date: 9/10/2020 11:46:11
From: mollwollfumble
ID: 1630414
Subject: re: Spherical Geometry
mollwollfumble said:
The Rev Dodgson said:
Code modified so the line weight for shapes after the first plot correctly:
The world map is starting to come together. It’s a bit of a slow process. Fingers crossed, when I have it finished all I’ll have to change to plot different variables will be the transparency.
Alphabetically up to Philippines. Colours so far are arbitrary, I haven’t yet corrected Brazil, Fiji, Timor-Leste, and Tierra del Fuego. The rest should be OK.
Date: 11/10/2020 05:25:39
From: mollwollfumble
ID: 1631311
Subject: re: Spherical Geometry
mollwollfumble said:
mollwollfumble said:
The Rev Dodgson said:
Code modified so the line weight for shapes after the first plot correctly:
The world map is starting to come together. It’s a bit of a slow process. Fingers crossed, when I have it finished all I’ll have to change to plot different variables will be the transparency.
Alphabetically up to Philippines. Colours so far are arbitrary, I haven’t yet corrected Brazil, Fiji, Timor-Leste, and Tierra del Fuego. The rest should be OK.
> Any questions or comments, let me know.
Yes. A question. Can I make the country borderlines thinner? Ditto vanish entirely?
Thinner borderlines would help with small countries such as Bahrain and Luxembourg and the South Pacific. No borderlines would help with the Caribbean.
Finished the world. I haven’t yet corrected Brazil, Fiji, Timor-Leste, Tierra del Fuego and South Sudan.
Then to start plotting real data.
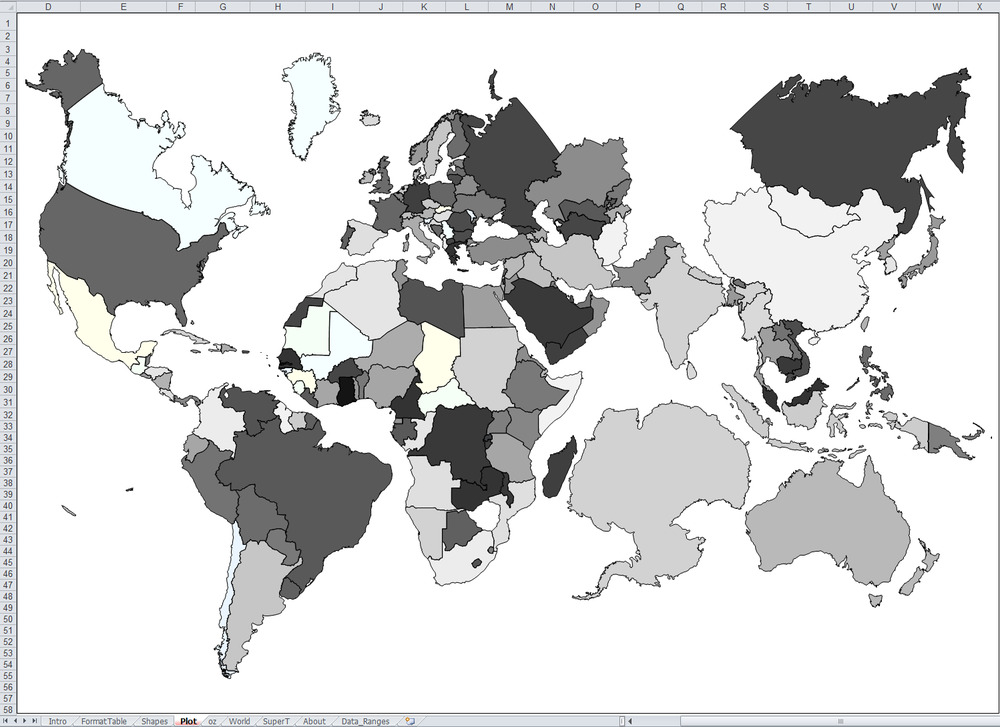
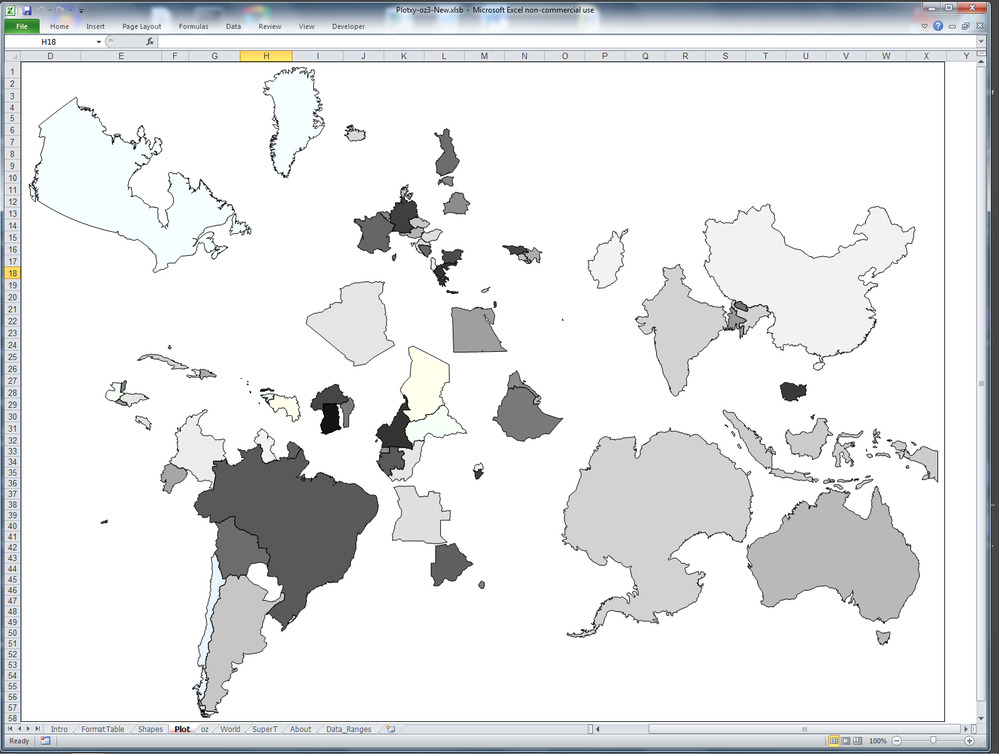
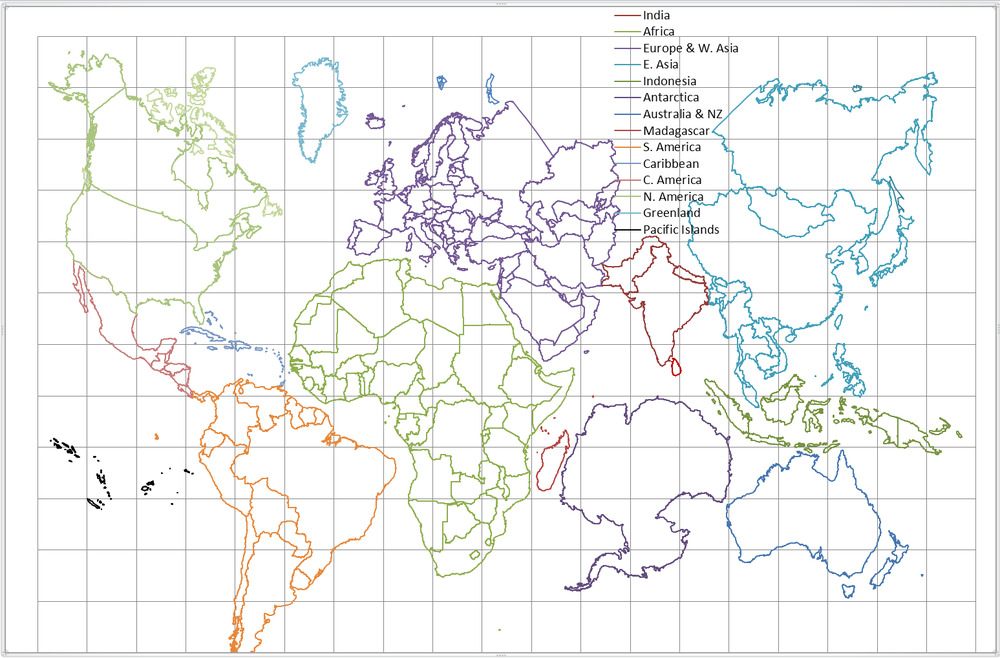
You may have noticed that there are fewer islands than in the old version, shown below. I’ve reduced the number to help me keep my sanity.
Date: 11/10/2020 08:28:25
From: Witty Rejoinder
ID: 1631322
Subject: re: Spherical Geometry
Are you still trying to get an equal area projection accurately because Australia looks too big compared the the USA
Date: 11/10/2020 08:31:09
From: Witty Rejoinder
ID: 1631323
Subject: re: Spherical Geometry
Witty Rejoinder said:
Are you still trying to get an equal area projection accurately because Australia looks too big compared the the USA
And Canada and China for that matter…
Date: 11/10/2020 09:18:42
From: The Rev Dodgson
ID: 1631331
Subject: re: Spherical Geometry
mollwollfumble said:
> Any questions or comments, let me know.
Yes. A question. Can I make the country borderlines thinner? Ditto vanish entirely?
Thinner borderlines would help with small countries such as Bahrain and Luxembourg and the South Pacific. No borderlines would help with the Caribbean.
Set the line weight (Col F) to zero for no line.
You can reduce the number for thinner lines, but any number > 0 will plot at least one pixel wide.
Date: 12/10/2020 21:36:28
From: Rule 303
ID: 1632157
Subject: re: Spherical Geometry
Date: 12/10/2020 21:39:38
From: party_pants
ID: 1632158
Subject: re: Spherical Geometry
Rule 303 said:
We’ll need a bigger digger….
Date: 12/10/2020 21:41:02
From: poikilotherm
ID: 1632160
Subject: re: Spherical Geometry
party_pants said:
Rule 303 said:
We’ll need a bigger digger….
We could import some Chinese to dig. I hear the ccp are selling some ughir slaves cheaply at the moment.
Date: 12/10/2020 21:42:56
From: party_pants
ID: 1632161
Subject: re: Spherical Geometry
poikilotherm said:
party_pants said:
Rule 303 said:
We’ll need a bigger digger….
We could import some Chinese to dig. I hear the ccp are selling some ughir slaves cheaply at the moment.
I was thinking big German and Japanese machinery.
Date: 12/10/2020 21:48:07
From: dv
ID: 1632162
Subject: re: Spherical Geometry
Date: 12/10/2020 21:52:07
From: party_pants
ID: 1632163
Subject: re: Spherical Geometry
party_pants said:
poikilotherm said:
party_pants said:
We’ll need a bigger digger….
We could import some Chinese to dig. I hear the ccp are selling some ughir slaves cheaply at the moment.
I was thinking big German and Japanese machinery.
We could probably flood the Lake Eyre basin without too much hassle. Everything else would have a few hundred metres of overburden to get down to sea level.
