mollwollfumble said:
dv said:
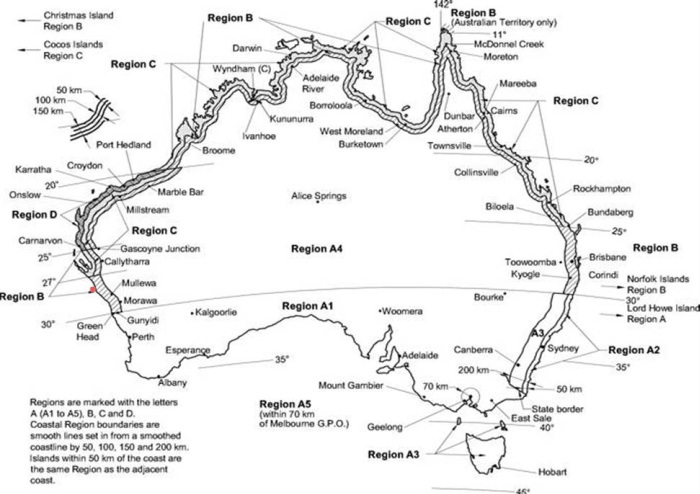
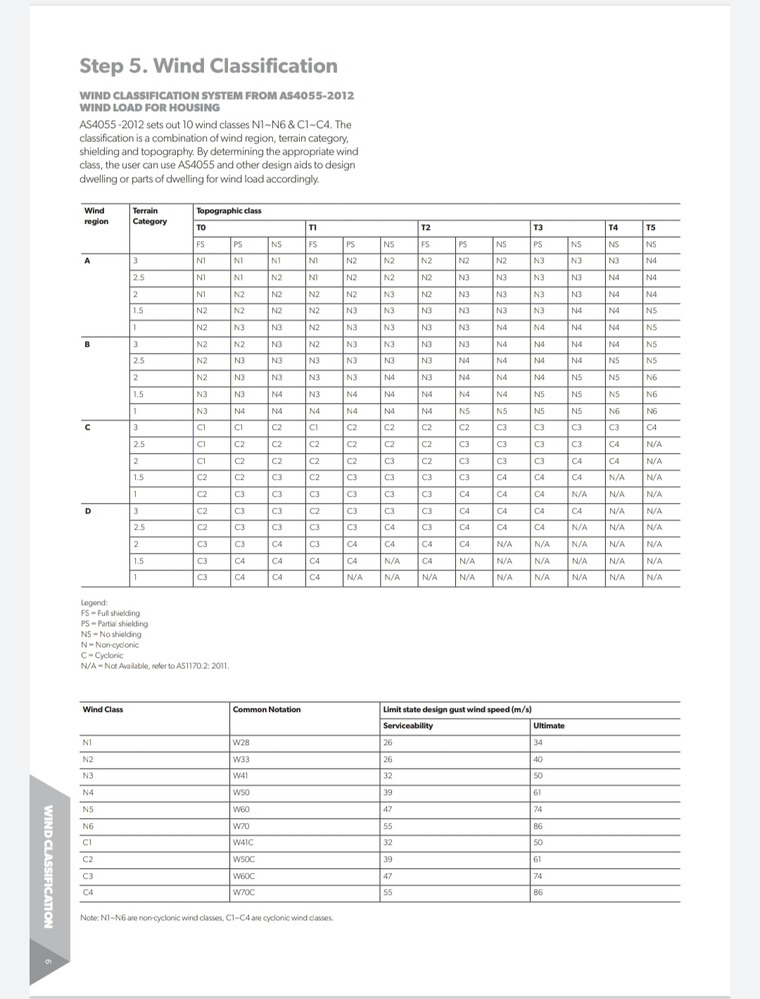
For construction purposes, Zones C and D are the cyclonic wind zones. Kalbarri is shown as a red dot in Zone B (“intermediate”).
It wouldn’t be right to change practice on the basis of a single event but one does hope that these zones are designed with an eye to the future with regard to climate change.
I know, personally, the two people who designed these zones. Bill Melbourne and John Holmes.
They caused John, in particular, a lot of sleepless nights. They are designed using what is called the Gumbel Plot, https://en.wikipedia.org/wiki/Gumbel_distribution . What that means is that the probability distribution is not a “normal distribution” and is very far from a normal distribution at extreme values. This gives the wind velocity distribution an extra boost to account for uncertainties due to the limited length of time over which data is collected (often less than 100 years). And also contains a factor of safety to account for the fact that anemometers are not placed in the direct path of the cyclone.
To give you an example of the challenges faced by the pair, the wind speed results from Amberley air force base didn’t match up with other measured wind speeds. They found that the original instrument was designed to measure wind speed in knots and when the standard changed the air force just replaced the recording gauge with miles per hour without applying the necessary 15% speed correction.
As the amount of reliable data increases, our cetainty of the values will improve, and predicted exteme wind speeds must decrease. This factor of safety well and truly exceeeds any deterministic change due to climate change. Or to put it another way, the uncertainly due to climate change is already factored into the standard.
> in the direct path of the cyclone.
Try that again. A correction to allow for the fact that anemometers are not often placed so that the strongest winds in the cyclone pass directly over the anemometer. And a correction to all for the fact that often anemometers are destroyed by cyclones because they’re not designed for wind speeds that strong.
So the three corrections together, those accounting for sampling errors due to the short length of data, the position of anemometer away from the strongest wind, and the destruction of anemometers by cyclonic winds, together apply a factor of safety to the standards that already covers climate change.
Consider for yourself. Suppose you want a 1% probability in 100 years. That’s a recurrence interval of 10,000 years. You only have 50 years of data to make that prediction from. That’s a representative problem that John Holmes and Bill Melbourne had to work with.
But not the only problem. John Holmes had to subtract off thunderstorm extreme winds to obtain cyclone extreme winds. It turns out that the two follow different Gumbel distributions. If you try to use the same Gumbel plot for both types of extreme winds together then the result can’t be fitted by a straight line on Gumbel plotting paper and the result would underestimate extreme cylonic winds. So the two sorts of extreme winds are separated out mathematically before plotting. Which they did, to more accurately predict cyclone extreme winds.
There is an extra factor of safety in the standard that I didn’t realise until long after I stopped corresponding with Bill and John. That’s the factor of safety associated with distance from the coast. Wind speeds drop off very rapidly inland with distance from the coast. To the extent that by landfall a lot of the wind speed has already been lost. So, for example, the cyclonic wind speeds measured at Magnetic Island are used for prediction of cyclonic wind speeds at Townsville. But being off the coast, cyclonic wind speeds at Magnetic Island are considerably larger than those on the coast, such as at Townsville. This provides an added (fourth) factor of safety.