mollwollfumble said:
Yippee. The results of the Australian Backyard Bird Count from Oct 2020 have just become available today.
Look to https://birdlife.org.au/images/uploads/ABBC/2020_ABBC_Species_list.xlsx
The results will become available on “Download the 2020 species list for Australia and the states/territories” on page https://aussiebirdcount.org.au/2020-results/ soon but at the moment it’s still a broken link.
This will be the first year where we will have enough data to get statistically reliable trends as to whether bird populations across Australia are increasing or declining in number, or just fluctuating randomly. Last year the strongest Australia-wide population trends to that date were that populations of little wattebird were increasing year by year and that populations of red wattlebird were decreasing year by year by the same amount. I can test that hypothesis now.
This is the chart from previous years.
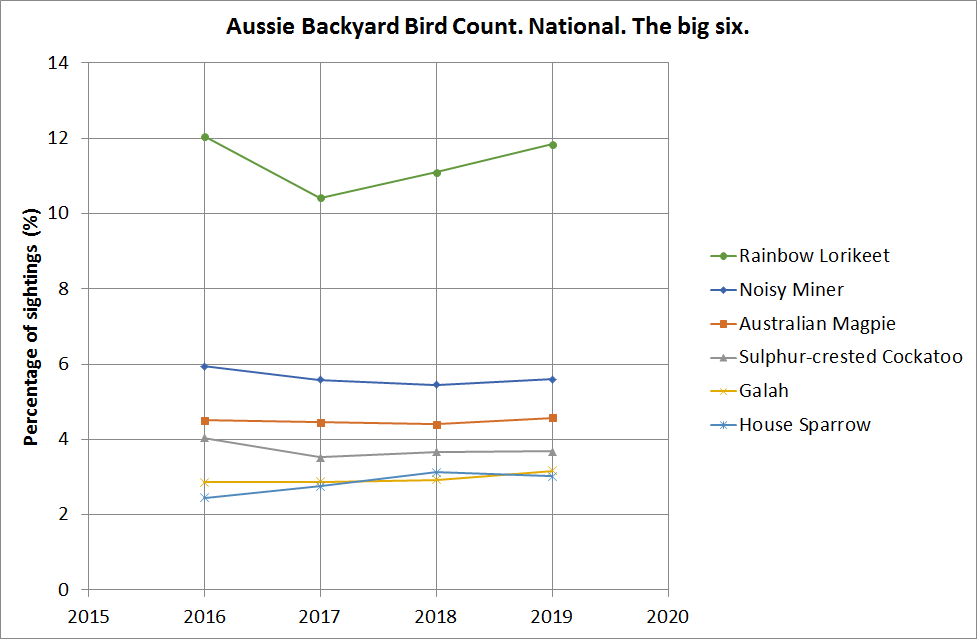
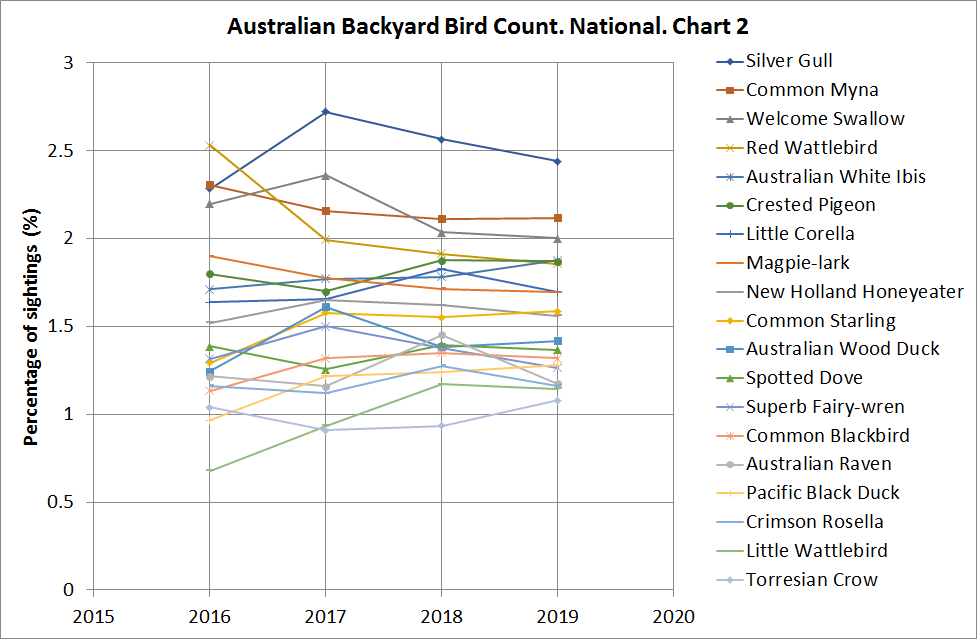
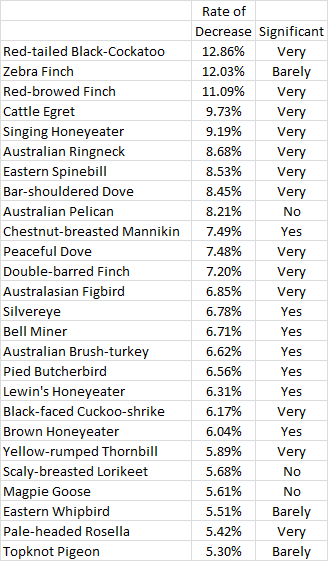
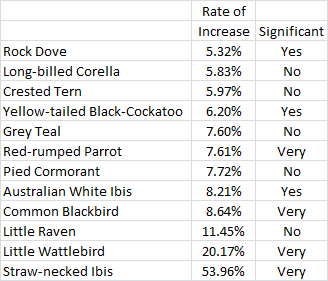
Adding in results from the year 2020, little wattlebird numbers continue to rise but red wattlebird numbers are back up again.
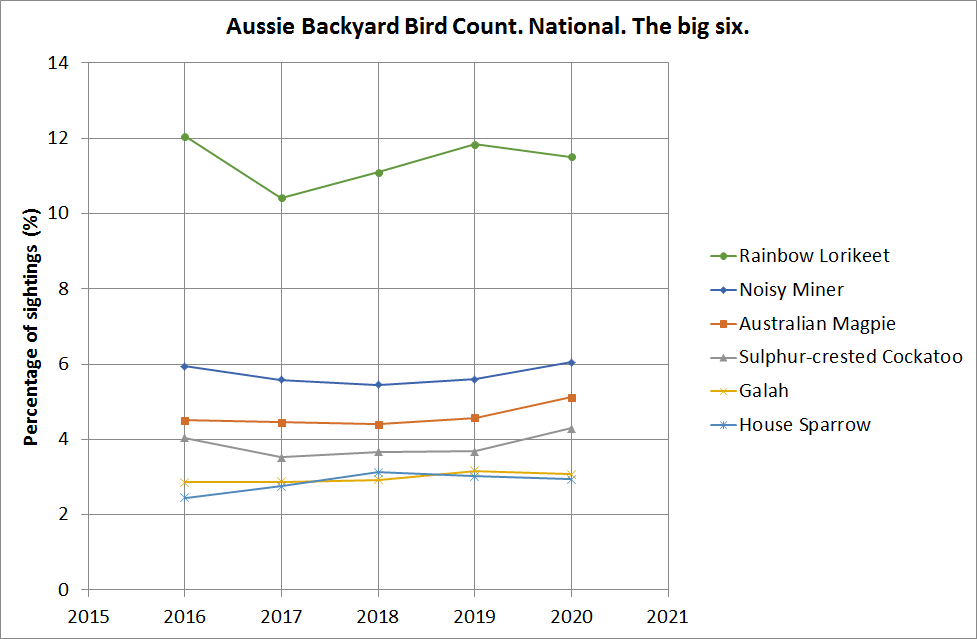
Sparrow numbers have fallen for two years in a row after an initial rise for two years in a row.
Overall, random fluctuations from year to year Australia-wide exceed trends over 5 years for the most commony seen birds.
None of the most commonly seen bird species has a dangerously rapid decline in numbers over 5 years. There is no “big loser”.
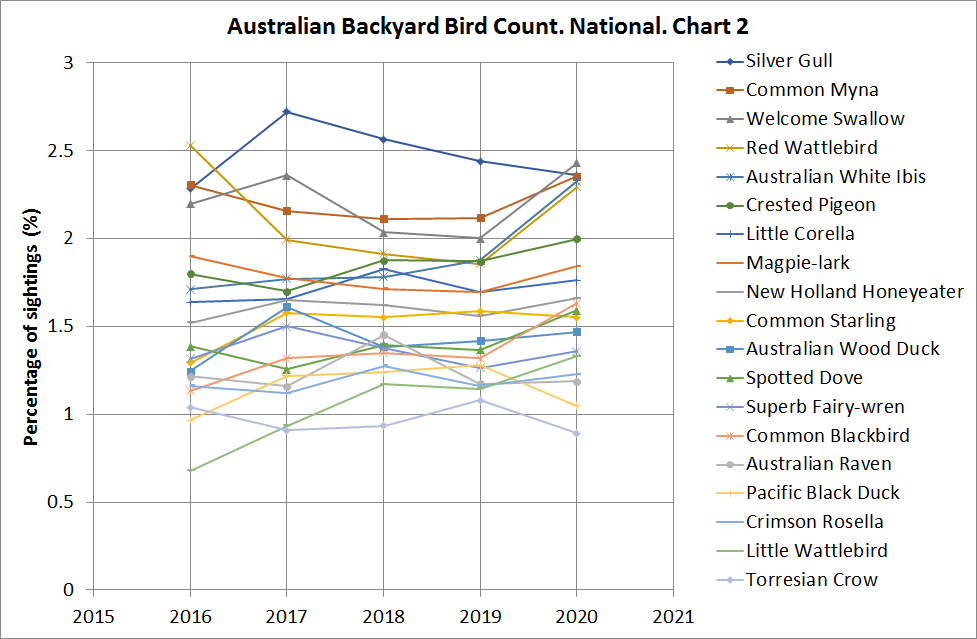
Good news, I added the 2020 results to the 2016-2019 results looking for trends.
The first good news is that the Australia-wide populations of none of the 25 most commonly seen bird species is collapsing. From 2016-2019 I had worries about the decline in sightings of the red wattlebird, but numbers have bounced back in 2020.
The other good news is that populations of introduced species (sparrow, myna, blackbird, spotted dove, starling) are not increasing Australia-wide to any measurable extent over 2016-2020. For instance, sparrow sightings increased from 2016 to 2018 and came back down from 2018 to 2020.
Apart from the little wattlebird, all 25 of the most commonly seen species have stable populations with large random year to year variations. Little wattlebird numbers appear to be increasing, from 0.68% of sightings in 2016 to 1.33% of sightings in 2020.