furious said:
buffy said:
mollwollfumble said:
“Statistics calculated over standard periods (commonly a 30 year interval) are often called climate normals, and are generally used as reference values for comparative purposes. The period is long enough to include the majority of typical year to year variations in the climate, but no so long that it is significantly influenced by longer-term changes in climate. In Australia, the current reference climate normal is generated over the 30-year period 1 January 1961 to 31 December 1990.”
30 years is good for temperatures. But for rainfall a much longer length of time would be needed to cover year to year variations. For cyclones, 150 years is nowhere near long enough, which is why numerical simulations are needed to extend the available period of observations for cyclones.
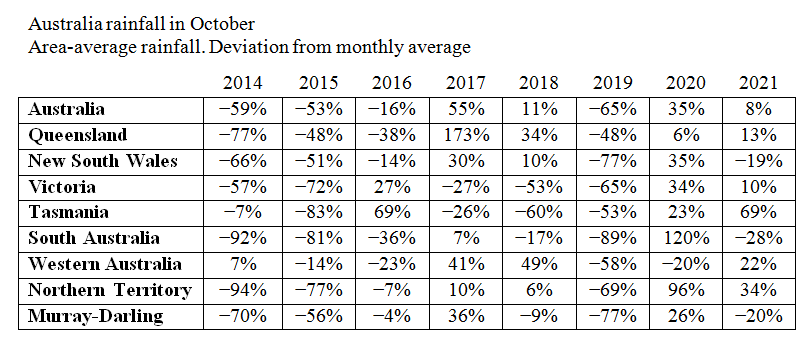
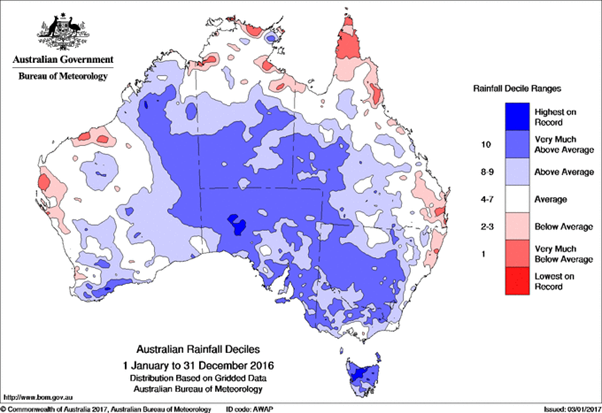
So the numbers you put up for rainfall, being from a 30 year block, are questionable?
In statistics, at least 30 data points are generally accepted as the minimum required for analysis…
> So the numbers you put up for rainfall, being from a 30 year block, are questionable?
That’s my personal opinion. I can actually calculate how inaccurate they are, but I won’t do that now. At a guess, 30 years won’t pin down mean rainfall to within a 5% error. It wouldn’t give much better than a 10% error, which is plenty large enough to show up on the charts above.
> In statistics, at least 30 data points are generally accepted as the minimum required for analysis…
Far from it, it depends on the ratio of the mean to the standard deviation. If the standard deviation is much smaller than the mean then sometimes as few as 4 points are sufficient to define the mean. 5 points can suffice for either the slope or standard deviation, whichever has the biggest influence.
But for rainfall, the mean is only about two times the standard deviation, so a lot more points are needed.