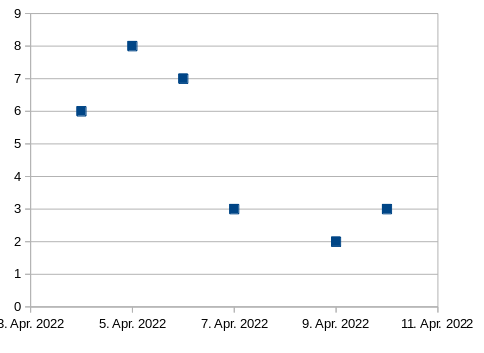
I have a combination bar/line graph where operational data are inputted each week and it calculates a utilisation factor. This utilisation factor is a ling on the graph *the only plotted against the secondary axis). Because this value is calculated by a formula it returns a value of 0 for all weeks where data is yet to be inputted. On the graph this manifests as a line that sits on the x-axis for all future weeks.
instead of the line doing the above, I want the line to not exist on the graph at all until a value has been entered. I’ve tried having the formula return a blank value (that is the formula returns “”) and I’ve also tried an autoformatting but I can’t seem to make it plot as if it is blank.
Any ideas? and no I don’t want to have to copy the formula over every week