Let’s see if my brain is up to this topic.
Fundamental to the first IPCC report is that 70% of global warming is caused by carbon dioxide.
The same number made it into the second IPCC report.
a) Prove it.
b) That calculation was done many decades ago, what percentage is it now?
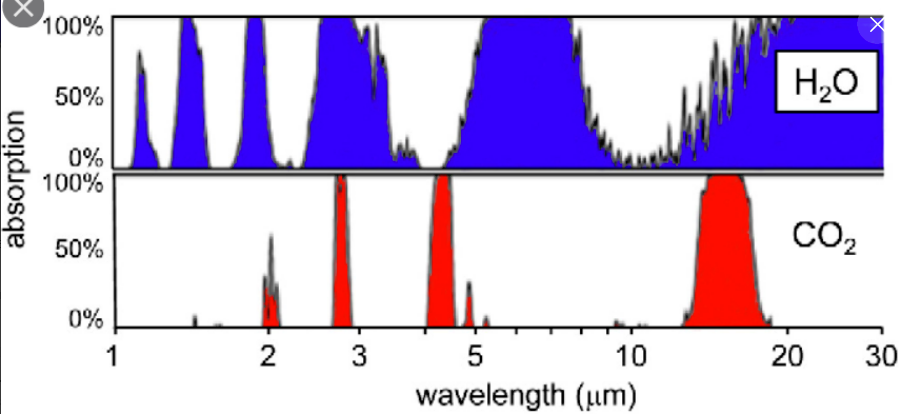
To answer this, I need to integrate the infrared absorption of CO2, after subtracting off the infrared absorption of H2O vapour.
I already know that H2O at atmospheric concentrations is a much stronger absorber of infrared than CO2. At a guess four to five times as strong, but I can check that. CO2 is relatively rigid because of its double bonds and linear shape, H2O is much more flexible because of its single bonds and bent shape. It is this flexibility that makes H2O such a great absorber of infrared radiation.
Calculating the IR absorption from CO2 directly from quantum mechanics would probably be a fiendishly difficult task. Because whereas the line frequencies are easily obtained from quantum mechanics, the line widths are not easy.
That gives the second method of calculation, experimental using measured IR absorption curves. IR absorption of CO2 has been measured as far back as about the 1850s, long before it was known that CO2 was a linear molecule with double bonds.
A good starting place to get some idea of the difficulty of the problem is this paper from 1932. https://tp.physique.usherbrooke.ca/experiences_fichiers/Fourier/References/CO2.pdf


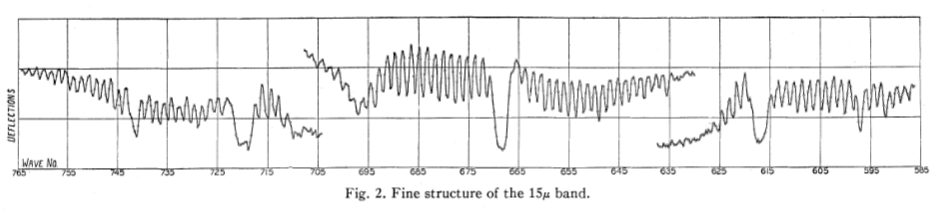
I need to integrate out the curve in Figure 2. And similar curves for the other spectral lines. The centre section has been amplified to better show it on the chart.
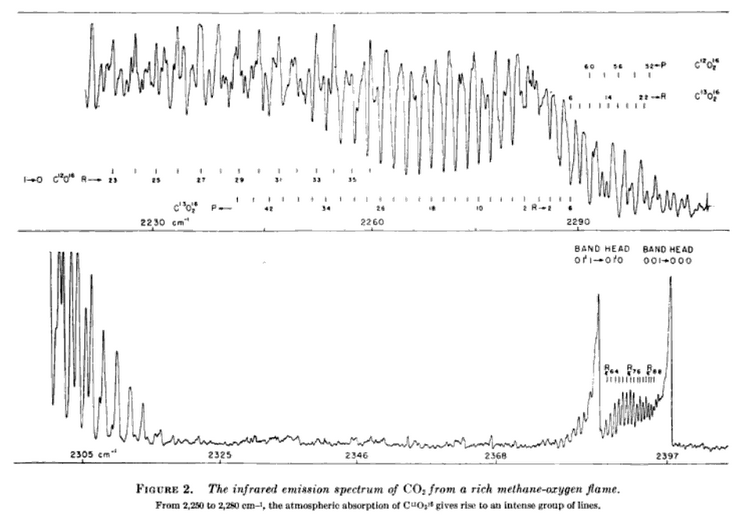
It’s no good using the IR absorption spectrum of CO2 in solid form or aqueous solution, those will be different. I don’t know if the infrared emission spectrum of CO2 can be used. If so, this is a chart from a book.
Other books are:
“Infrared Absorption Spectrum of Carbon Dioxide”, 1932
“Infrared Absorption by Carbon Dioxide, Water Vapor, and …”, 1962
“The Infrared Absorption of Carbon Dioxide”, 1961
“Infrared Absorption of Carbon Dioxide and Water Vapor …”, 1969
“The Infrared Absorption Spectrum of Water Vapor and Carbon …”, 1962
“ Determination of Carbon Monoxide and Carbon Dioxide Concentrations at Temperatures Between 295-1250 K Using Fourier Transform Infrared Absorption Spectroscopy”, 1992
etc.
Articles:
“Absorption cross section measurements of carbon dioxide in the wavelength region 118.7–175.5 nm and the temperature dependence”, 1996
“The infrared absorption of carbon dioxide”, 1963
The last of these is subtitled “The infrared absorption of carbon dioxide was calculated over a wide range of path length
and pressure from 1500 to 110,000 cm. The results are presented in extensive tables” which looks promising. Let’s try that.
Nope, have to sign in to the US department of defence to read that one.
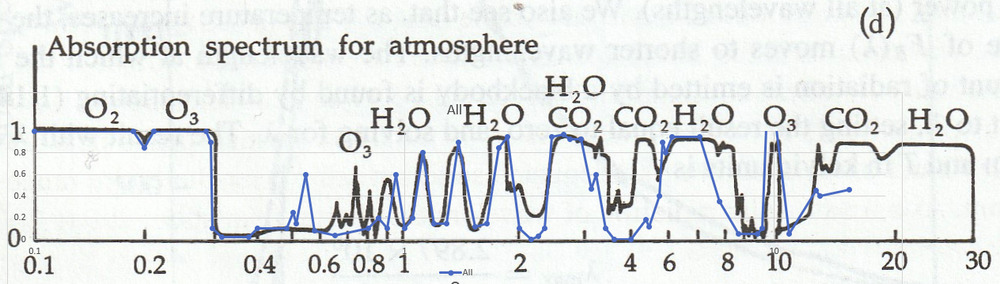
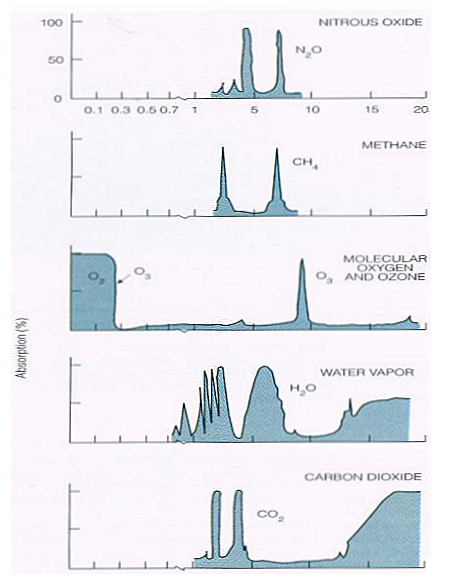
Fine. Before I started typing here I already had rough charts of IR absorbance for CO2 and H2O from the book by Seinfeld and Pandis “Atmospheric Chemistry and Physics”, 1998. Let’s look and see where they get their information. The following is a scan of their Page 28.
If I start with the curve in d, subtract off the curves in b and c, that gives the absorption due to CO2 (and minor gases). And multiply that by the curve in a to get the total absorption of IR by a normal amount of CO2.
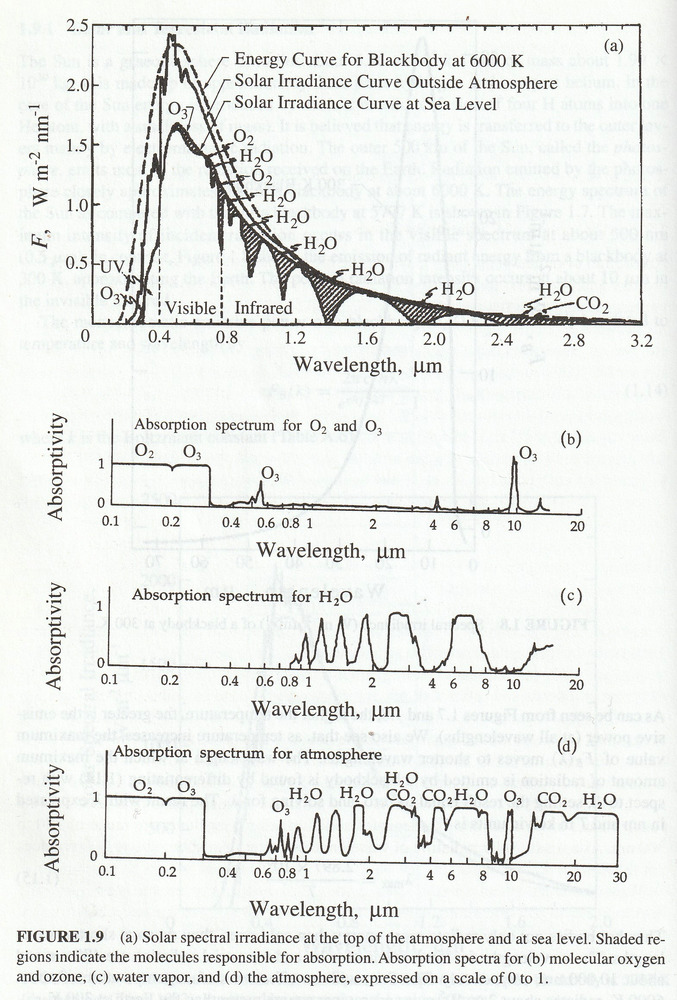
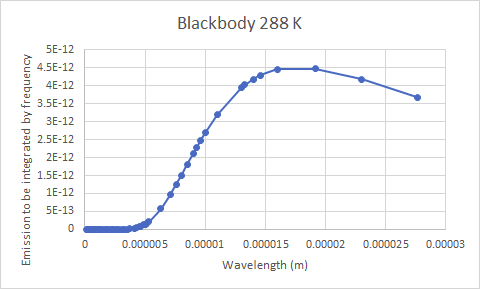
The relationship between concentration and absorptivity is nonlinear, but if I subtract from 1, multiply by the CO2 concentration ratio and subtract from 1 again. Then multiply by the curve in a, and integrate over wavelength then I could see by how much a change in CO2 concentration affects … Oops. Not quite right. I’d have to use a black body emitter at Earth’s average temperature instead of at the Sun’s temperature to replace Figure a. Then I could get the correct answer. And simply plug the resulting IR absorption from varying CO2 concentrations into the radiation balance equation for Earth to get the global warming due to a rise in CO2 concentration.
OK, so I can do it. This empirical approach is much much much easier than using full quantum chemical calculations.
But can I do it more accurately?
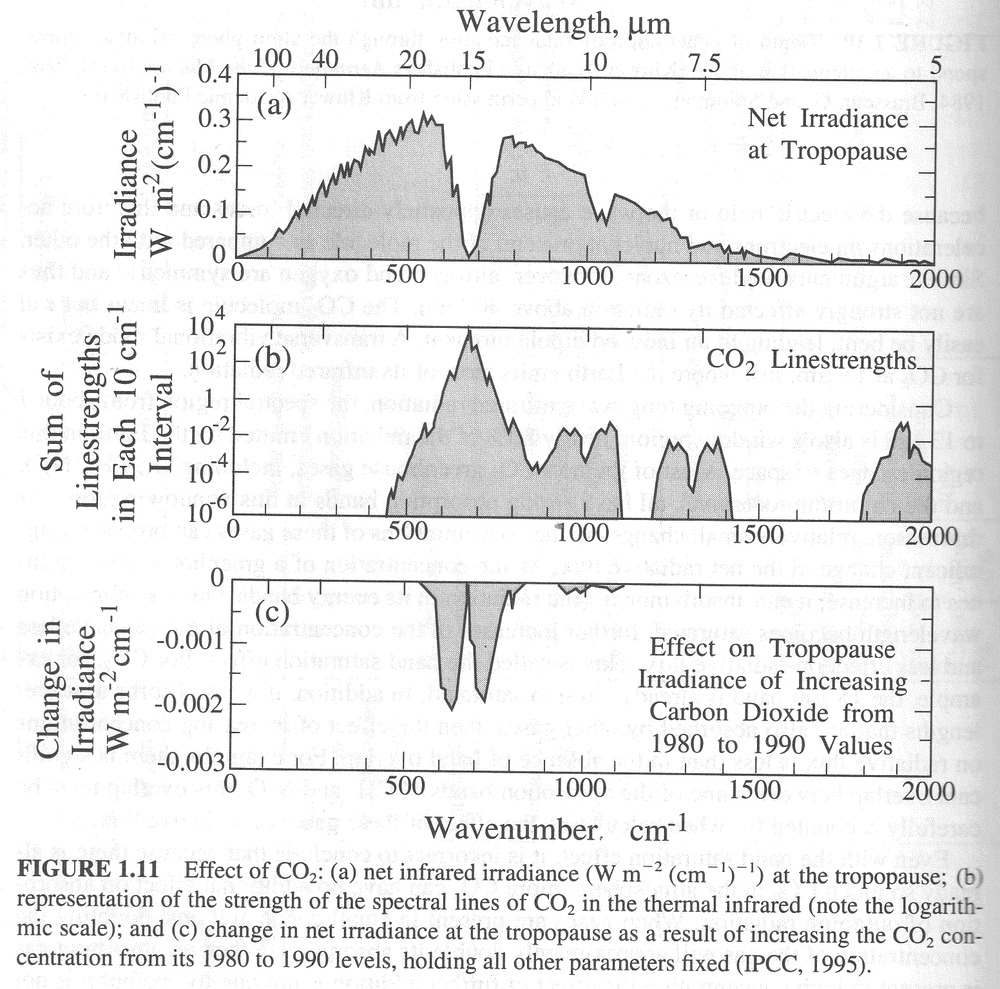
The following chart is from Seinfeld and Pandis Page 32.
This chart comes from the IPCC, but where does the IPCC get its information from?