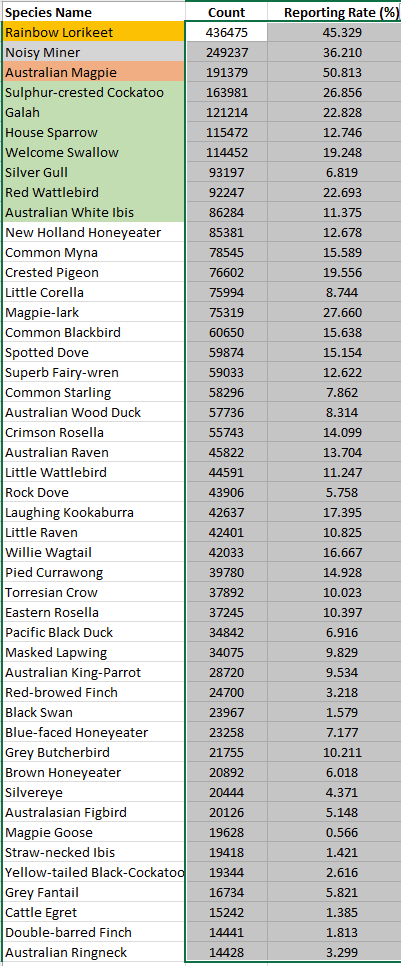
One thing I’ve been doing is analysing the data from the ABBC to see which species of birds are at risk, and which are benefiting from human interaction. Because of the way that the ABBC is set up, I’ve limited the analysis to the 100 or so most commonly seen bird species. Below that limit, and the influences from individual bird observers start to become significant, and numbers of birds seen become so low that statistical accuracy is compromised.
Up front, I want to add that observed numbers of all waterbirds fluctuate wildly from year to year in Australia. For those common mostly in southern Australia, these tend to move in step, but not in step with those from northern Australia. Waterbirds affected include coot, hardhead, both of the teals, swans, pelicans, magpie geese, whistling ducks, straw-necked ibis, etc.
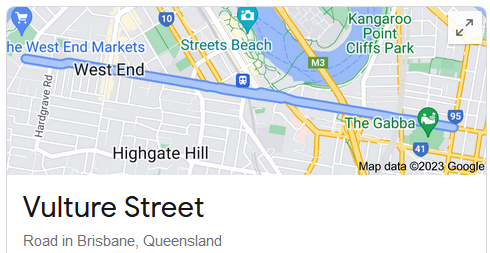
The previous analysis was 2016 to 2020, five years of data. I’ve now extended this to 2016-2022, seven years of data. Results from the year 2016 are a bit iffy because the ABBC was still limited by inexperience. Another problem is that occasionally species get lumped together when they shouldn’t be, and this particularly affected the little wattlebird in the early years where it was erroneously misnamed as red wattlebird in one state.
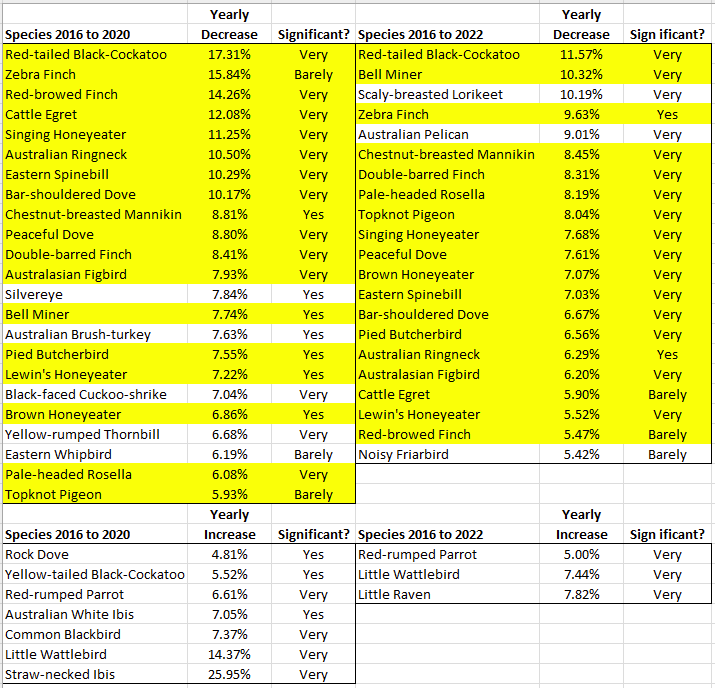
Anyway, the results. The first table has preliminary results on the left and final results on the right. Birds declining in numbers at the top and birds increasing in numbers at the bottom. Those highlighted in yellow show a decline in numbers in both preliminary and final analyses, though often with a quite different calculated rate of decline (in percent per year).
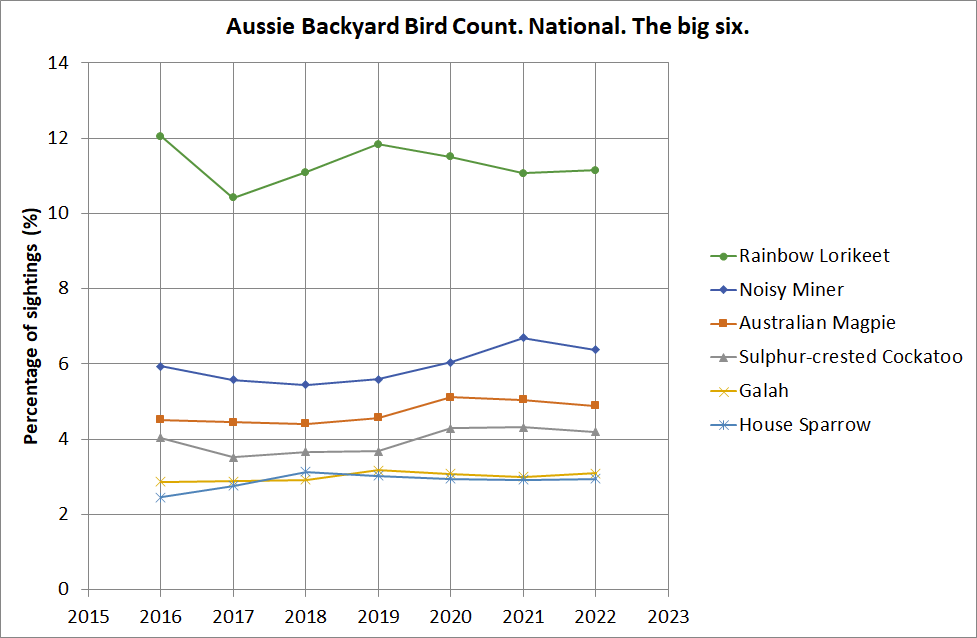
First graph is a plot over time of the six most commonly seen bird species. Thankfully, no hugely significant trends, particularly no huge increase in sparrow numbers.
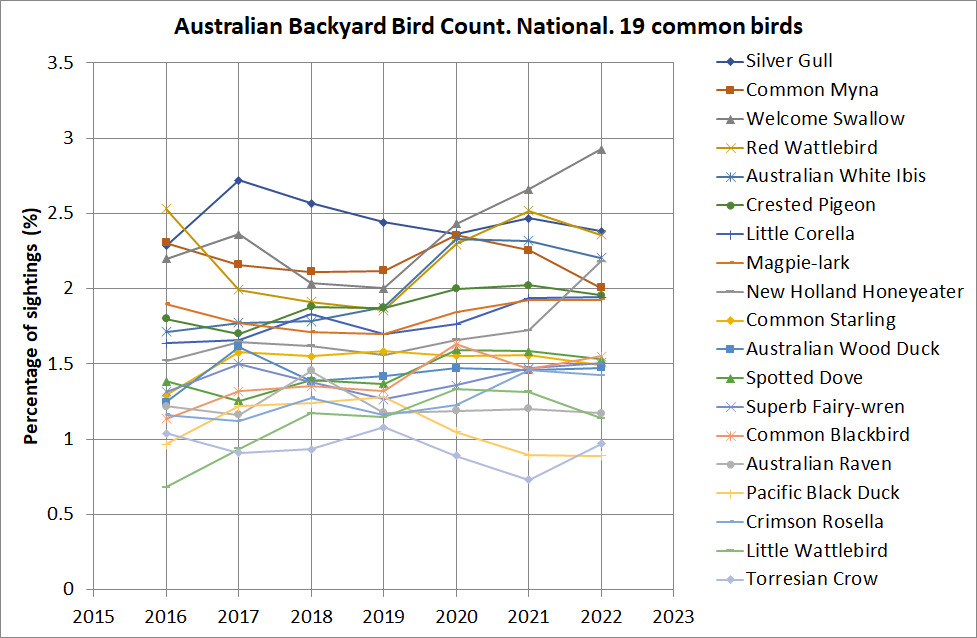
Second graph. The 19 next most commonly seen birds. Again, no hugely significant trends. There’s an overall increase in crested pigeon sightings.
Third graph. Other birds, in alphabetical order. Some species have a significant decrease in sightings. The Ringneck parrot was looking badly off until a resurgence in 2022. Figbird and Bellbird numbers are going down, but both have seen a slight reversal in 2022.

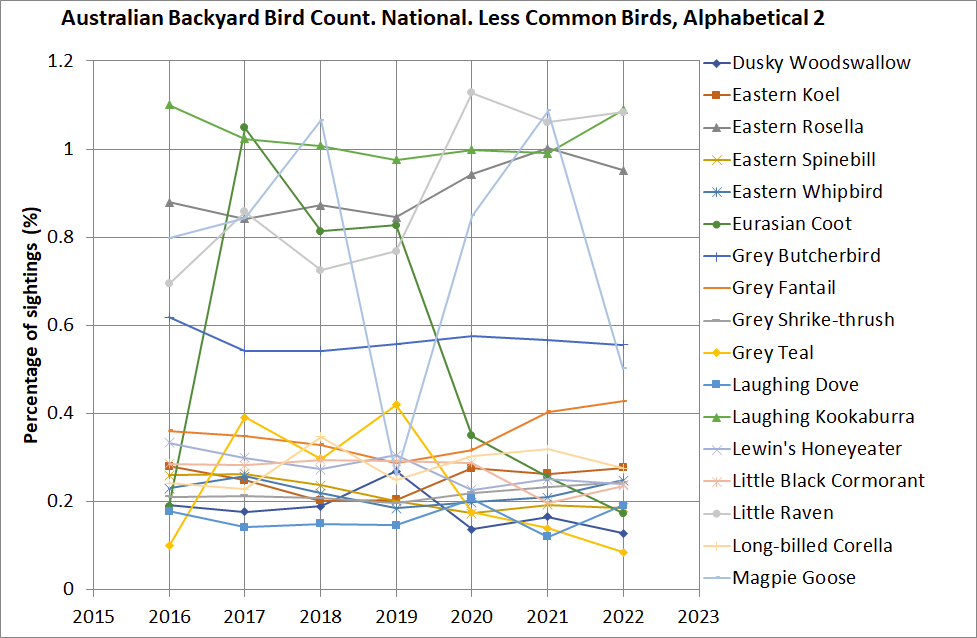
Fourth graph. Other birds, in alphabetical order. This chart is dominated by massive ups and downs in numbers of waterbirds seen. Particularly of the Coot.
Fifth graph. Other birds, in alphabetical order. There is a decline in the Pied Butcherbird and Peaceful Dove numbers seen. Red-browed finches were looking in a very bad way from 2016 to 2020, but have had a beautiful resurgence in 2021 and 2022. Ditto Red-tailed Cockatoo, but the resurgence has been less.

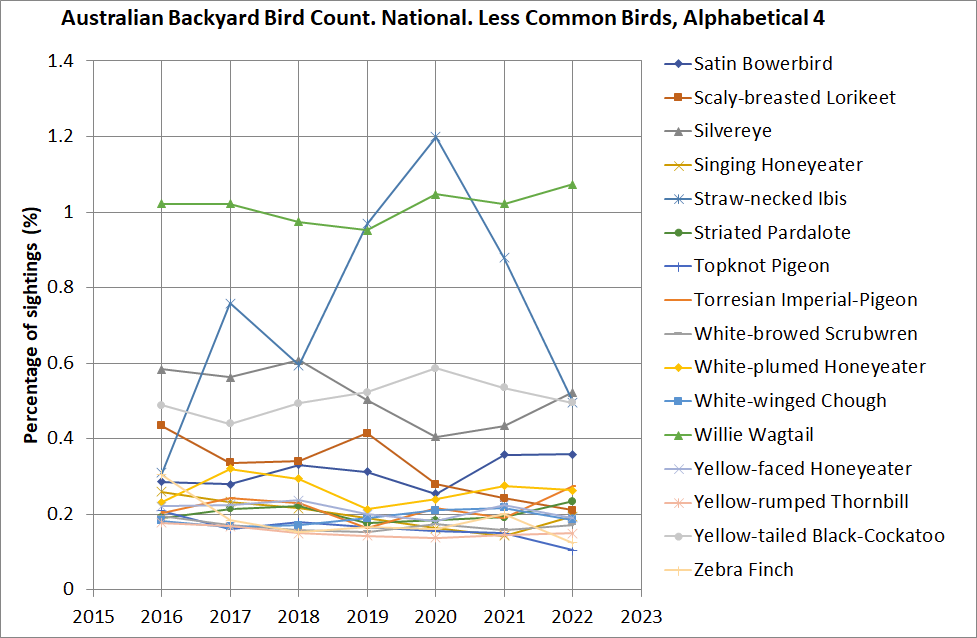
Sixth and final graph. The Straw-necked Ibis showed a startling increase in numbers from 2016 to 2020, but returned to original levels in 2021 and 2022. The topknot pigeon and scaly-breasted lorikeet have shown a decline.
And that’s it. The most serious decline in numbers is the Red-tailed Cockatoo but there has been a slight increase in numbers in 2021 and 2022.