Date: 28/12/2023 19:16:59
From: mollwollfumble
ID: 2107881
Subject: 3 questions for permeate-free (and anyone else)
> That’s fine moll, but might I suggest with areas you are less familiar such as environment matters which have many influences, that you do your research first including the most recent scientific investigations and only then make your opinions known.
As you so rightly point out, I am not at all familiar with recent scientific publications on environmental matters. You are, so perhaps you can help me on three pieces of information where I’m not up to date.
1. When did the Scandinavian permanent ice-cap finally disappear?
I’ve seen estimates ranging from 500 BC all the way back to 10,000 BC.
2. Back in the first and second IPCC scientific reports, it was stated that approximately 70% of global warming is due directly to atmospheric CO2 increases (without feedback amplification or effects of other greenhouse gases). That was in 1990, a long time ago. How much of global warming is directly due to atmospheric CO2 now, after 30 more years of detailed observation.
3. I used to have a plot of sea level rise since 10,000 BC, based on coral growth data. But I lost the reference. What does the most recent version look like?
Date: 28/12/2023 19:31:45
From: PermeateFree
ID: 2107884
Subject: re: 3 questions for permeate-free (and anyone else)
mollwollfumble said:
> That’s fine moll, but might I suggest with areas you are less familiar such as environment matters which have many influences, that you do your research first including the most recent scientific investigations and only then make your opinions known.
As you so rightly point out, I am not at all familiar with recent scientific publications on environmental matters. You are, so perhaps you can help me on three pieces of information where I’m not up to date.
1. When did the Scandinavian permanent ice-cap finally disappear?
I’ve seen estimates ranging from 500 BC all the way back to 10,000 BC.
2. Back in the first and second IPCC scientific reports, it was stated that approximately 70% of global warming is due directly to atmospheric CO2 increases (without feedback amplification or effects of other greenhouse gases). That was in 1990, a long time ago. How much of global warming is directly due to atmospheric CO2 now, after 30 more years of detailed observation.
3. I used to have a plot of sea level rise since 10,000 BC, based on coral growth data. But I lost the reference. What does the most recent version look like?
Why don’t you just google them. You will get more information than I and most people could give you of the top of our heads. Most people do not walk around with a very long list of facts and figures in the event of someone wanting to know. That is what books, etc. are for.
Date: 28/12/2023 23:41:30
From: esselte
ID: 2107942
Subject: re: 3 questions for permeate-free (and anyone else)
mollwollfumble said:
2. Back in the first and second IPCC scientific reports, it was stated that approximately 70% of global warming is due directly to atmospheric CO2 increases (without feedback amplification or effects of other greenhouse gases). That was in 1990, a long time ago. How much of global warming is directly due to atmospheric CO2 now, after 30 more years of detailed observation.
The atmospheric abundance and radiative forcing of the three main long-lived greenhouse gases (CO₂, CH₄, and N₂O) continue to increase. While the combined radiative forcing of these and all other greenhouse gases included in the AGGI rose 49% from 1990 to 2021 (by ~1.06 watts per square meter), carbon dioxide has accounted for about 80% of this increase (~0.85 watts per square meter), which makes it by far the biggest contributor to increases in climate forcing since 1990. Radiative forcing from methane has steadily increased since 2007, after having been nearly constant from 1999 to 2006. Owing to the Montreal Protocol, an international agreement signed in 1987, CFCs have been decreasing since the mid- to late 1990s after a long period of increase; however, the current warming influence from CFCs and related gases is still larger than that from HCFCs and HFCs. CFC replacements (HCFCs and HFCs) have been increasing since the phase-out of CFCs.

https://www.globalchange.gov/indicators/annual-greenhouse-gas-index
Date: 29/12/2023 01:40:49
From: PermeateFree
ID: 2107960
Subject: re: 3 questions for permeate-free (and anyone else)
esselte said:
mollwollfumble said:
2. Back in the first and second IPCC scientific reports, it was stated that approximately 70% of global warming is due directly to atmospheric CO2 increases (without feedback amplification or effects of other greenhouse gases). That was in 1990, a long time ago. How much of global warming is directly due to atmospheric CO2 now, after 30 more years of detailed observation.
The atmospheric abundance and radiative forcing of the three main long-lived greenhouse gases (CO₂, CH₄, and N₂O) continue to increase. While the combined radiative forcing of these and all other greenhouse gases included in the AGGI rose 49% from 1990 to 2021 (by ~1.06 watts per square meter), carbon dioxide has accounted for about 80% of this increase (~0.85 watts per square meter), which makes it by far the biggest contributor to increases in climate forcing since 1990. Radiative forcing from methane has steadily increased since 2007, after having been nearly constant from 1999 to 2006. Owing to the Montreal Protocol, an international agreement signed in 1987, CFCs have been decreasing since the mid- to late 1990s after a long period of increase; however, the current warming influence from CFCs and related gases is still larger than that from HCFCs and HFCs. CFC replacements (HCFCs and HFCs) have been increasing since the phase-out of CFCs.
https://www.globalchange.gov/indicators/annual-greenhouse-gas-index
The above although accurately depicting the recent and current situation of greenhouse gases, gives little account of the years of building temperatures (due to our co2 emissions) that are now in the process of creating the environmental conditions for higher methane emissions. When the stage is set, like the additional melting of the permafrost (as recent studies have shown), it will change the causation of global warming significantly.
With the dramatic changes that are taking place generated by increasing temperatures, there is little point in placing too much faith in the data of our own emissions to predict future outcomes, as we are beginning to see the results of our current activities on the environment that will become increasingly beyond our control.
Date: 29/12/2023 01:46:45
From: roughbarked
ID: 2107961
Subject: re: 3 questions for permeate-free (and anyone else)
PermeateFree said:
esselte said:
mollwollfumble said:
2. Back in the first and second IPCC scientific reports, it was stated that approximately 70% of global warming is due directly to atmospheric CO2 increases (without feedback amplification or effects of other greenhouse gases). That was in 1990, a long time ago. How much of global warming is directly due to atmospheric CO2 now, after 30 more years of detailed observation.
The atmospheric abundance and radiative forcing of the three main long-lived greenhouse gases (CO₂, CH₄, and N₂O) continue to increase. While the combined radiative forcing of these and all other greenhouse gases included in the AGGI rose 49% from 1990 to 2021 (by ~1.06 watts per square meter), carbon dioxide has accounted for about 80% of this increase (~0.85 watts per square meter), which makes it by far the biggest contributor to increases in climate forcing since 1990. Radiative forcing from methane has steadily increased since 2007, after having been nearly constant from 1999 to 2006. Owing to the Montreal Protocol, an international agreement signed in 1987, CFCs have been decreasing since the mid- to late 1990s after a long period of increase; however, the current warming influence from CFCs and related gases is still larger than that from HCFCs and HFCs. CFC replacements (HCFCs and HFCs) have been increasing since the phase-out of CFCs.
https://www.globalchange.gov/indicators/annual-greenhouse-gas-index
The above although accurately depicting the recent and current situation of greenhouse gases, gives little account of the years of building temperatures (due to our co2 emissions) that are now in the process of creating the environmental conditions for higher methane emissions. When the stage is set, like the additional melting of the permafrost (as recent studies have shown), it will change the causation of global warming significantly.
With the dramatic changes that are taking place generated by increasing temperatures, there is little point in placing too much faith in the data of our own emissions to predict future outcomes, as we are beginning to see the results of our current activities on the environment that will become increasingly beyond our control.
What I do know is when the cat is out of the bag, it is incredibly difficult to get it to go back in.
Date: 29/12/2023 06:49:40
From: Ogmog
ID: 2107976
Subject: re: 3 questions for permeate-free (and anyone else)
roughbarked said:
PermeateFree said:
esselte said:
The atmospheric abundance and radiative forcing of the three main long-lived greenhouse gases (CO₂, CH₄, and N₂O) continue to increase. While the combined radiative forcing of these and all other greenhouse gases included in the AGGI rose 49% from 1990 to 2021 (by ~1.06 watts per square meter), carbon dioxide has accounted for about 80% of this increase (~0.85 watts per square meter), which makes it by far the biggest contributor to increases in climate forcing since 1990. Radiative forcing from methane has steadily increased since 2007, after having been nearly constant from 1999 to 2006. Owing to the Montreal Protocol, an international agreement signed in 1987, CFCs have been decreasing since the mid- to late 1990s after a long period of increase; however, the current warming influence from CFCs and related gases is still larger than that from HCFCs and HFCs. CFC replacements (HCFCs and HFCs) have been increasing since the phase-out of CFCs.
https://www.globalchange.gov/indicators/annual-greenhouse-gas-index
The above although accurately depicting the recent and current situation of greenhouse gases, gives little account of the years of building temperatures (due to our co2 emissions) that are now in the process of creating the environmental conditions for higher methane emissions. When the stage is set, like the additional melting of the permafrost (as recent studies have shown), it will change the causation of global warming significantly.
With the dramatic changes that are taking place generated by increasing temperatures, there is little point in placing too much faith in the data of our own emissions to predict future outcomes, as we are beginning to see the results of our current activities on the environment that will become increasingly beyond our control.
What I do know is when the cat is out of the bag, it is incredibly difficult to get it to go back in.
and every other metaphor you choose to use
whether it’s a Genie back into the Bottle
Imps back into Pandora’s Box
or Al Gore back in Office
many people saw this coming WAY Down the Road.
Date: 29/12/2023 07:07:41
From: roughbarked
ID: 2107979
Subject: re: 3 questions for permeate-free (and anyone else)
Ogmog said:
roughbarked said:
PermeateFree said:
The above although accurately depicting the recent and current situation of greenhouse gases, gives little account of the years of building temperatures (due to our co2 emissions) that are now in the process of creating the environmental conditions for higher methane emissions. When the stage is set, like the additional melting of the permafrost (as recent studies have shown), it will change the causation of global warming significantly.
With the dramatic changes that are taking place generated by increasing temperatures, there is little point in placing too much faith in the data of our own emissions to predict future outcomes, as we are beginning to see the results of our current activities on the environment that will become increasingly beyond our control.
What I do know is when the cat is out of the bag, it is incredibly difficult to get it to go back in.
and every other metaphor you choose to use
whether it’s a Genie back into the Bottle
Imps back into Pandora’s Box
or Al Gore back in Office
many people saw this coming WAY Down the Road.
But nobody believed them even when they’d done thousands of studies and waved papers graphs and pictures at each other and even then said go get more information because it cannot possibly be true. God gave us the earth to do whatever we wanted with.
Date: 29/12/2023 10:33:18
From: Ogmog
ID: 2108030
Subject: re: 3 questions for permeate-free (and anyone else)
roughbarked said:
Ogmog said:
roughbarked said:
What I do know is when the cat is out of the bag, it is incredibly difficult to get it to go back in.
and every other metaphor you choose to use
whether it’s a Genie back into the Bottle
Imps back into Pandora’s Box
or Al Gore back in Office
many people saw this coming WAY Down the Road.
But nobody believed them even when they’d done thousands of studies and waved papers graphs and pictures at each other and even then said go get more information because it cannot possibly be true. God gave us the earth to do whatever we wanted with.
Ah, Yes!
The (in)FAMOUS “HOCKEY STICK GRAPH” …
The term hockey stick graph was popularized by the climatologist Jerry Mahlman, to describe the pattern shown by the Mann, Bradley & Hughes 1999 (MBH99) reconstruction, envisaging a graph that is relatively flat with a downward trend to 1900 as forming an ice hockey stick’s “shaft” followed by a sharp, steady increase corresponding to the “blade” portion. The reconstructions have featured in Intergovernmental Panel on Climate Change (IPCC) reports as evidence of global warming.

Arguments over the reconstructions have been taken up by fossil fuel industry funded lobbying groups attempting to cast doubt on climate science.
Date: 29/12/2023 10:56:41
From: Ogmog
ID: 2108038
Subject: re: 3 questions for permeate-free (and anyone else)
round and round she goes
and where she stops…nobody knows.
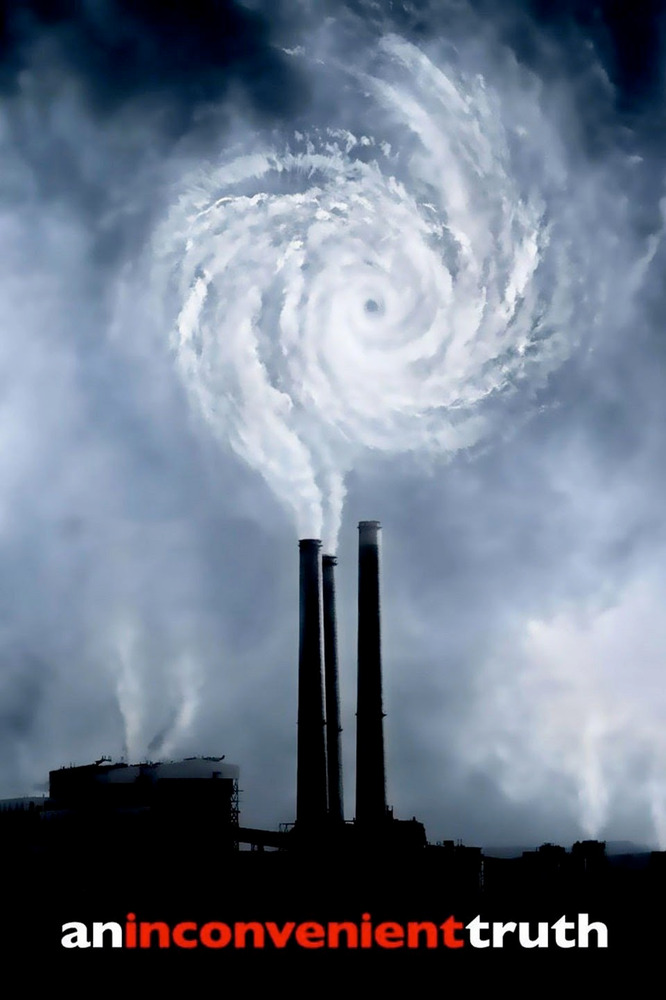
What is the main message of An Inconvenient Truth?
Albeit coming off like a political campaign at times, An Inconvenient Truth
does throw up serious questions about our individual responsibility towards
meeting the challenge of climate change. Its main message is that global
warming presents a “moral imperative” to each and every person.
however the graph and the core message was derided by The Power Piggies
(of which The BUSH and Cheny Families were heavily invested)
and even though PRESIDENT Gore actually WON The presidential election
he was forced to concede the election in favour of George DUHbya BUSH
who along with his new VICE Pres DICK Cheny took the opportunity to
go to war with an innocent nation in order to STEAL Their FOSSIL FUEL
then soon after doubling down on the harm by FRACKING for Methane.
…the rest, as they say, is history.
Date: 29/12/2023 11:03:25
From: roughbarked
ID: 2108043
Subject: re: 3 questions for permeate-free (and anyone else)
Ogmog said:
round and round she goes
and where she stops…nobody knows.
What is the main message of An Inconvenient Truth?
Albeit coming off like a political campaign at times, An Inconvenient Truth
does throw up serious questions about our individual responsibility towards
meeting the challenge of climate change. Its main message is that global
warming presents a “moral imperative” to each and every person.
however the graph and the core message was derided by The Power Piggies
(of which The BUSH and Cheny Families were heavily invested)
and even though PRESIDENT Gore actually WON The presidential election
he was forced to concede the election in favour of George DUHbya BUSH
who along with his new VICE Pres DICK Cheny took the opportunity to
go to war with an innocent nation in order to STEAL Their FOSSIL FUEL
then soon after doubling down on the harm by FRACKING for Methane.
…the rest, as they say, is history.

Date: 29/12/2023 12:07:20
From: mollwollfumble
ID: 2108071
Subject: re: 3 questions for permeate-free (and anyone else)
PermeateFree said:
Why don’t you just google them. You will get more information than I and most people could give you of the top of our heads. Most people do not walk around with a very long list of facts and figures in the event of someone wanting to know. That is what books, etc. are for.
Googling is not the same as reading the scientific literature.
esselte said:
mollwollfumble said:
2. Back in the first and second IPCC scientific reports, it was stated that approximately 70% of global warming is due directly to atmospheric CO2 increases (without feedback amplification or effects of other greenhouse gases). That was in 1990, a long time ago. How much of global warming is directly due to atmospheric CO2 now, after 30 more years of detailed observation.
The atmospheric abundance and radiative forcing of the three main long-lived greenhouse gases (CO₂, CH₄, and N₂O) continue to increase. While the combined radiative forcing of these and all other greenhouse gases included in the AGGI rose 49% from 1990 to 2021 (by ~1.06 watts per square meter), carbon dioxide has accounted for about 80% of this increase (~0.85 watts per square meter), which makes it by far the biggest contributor to increases in climate forcing since 1990. Radiative forcing from methane has steadily increased since 2007, after having been nearly constant from 1999 to 2006. Owing to the Montreal Protocol, an international agreement signed in 1987, CFCs have been decreasing since the mid- to late 1990s after a long period of increase; however, the current warming influence from CFCs and related gases is still larger than that from HCFCs and HFCs. CFC replacements (HCFCs and HFCs) have been increasing since the phase-out of CFCs.
https://www.globalchange.gov/indicators/annual-greenhouse-gas-index
Lovely chart. I see that the radiative forcing from CFCs has shrunk, as I expected. I was not expecting the radiative forcing from HCFCs to have increased by that amount.
Due to tighter emission controls from vehicles, and the global introduction of catalytic converters, the radiative forcing from nitrous oxide should have shrunk, but it’s shown strong growth – I’ll have to look that that.
The radiative forcing from methane is close to constant, as expected.
The radiative forcing from carbon dioxide has increased enormously. Making it a much greater contributor to total radiative forcing. Up from 60% in 1979 to 67% in 2021.
The caveat here is that water vapour, over which we have no control, is the most important radiative forcer of all. And that water droplets in clouds is the most important cooling agent of all. Further, the absorption bands of water vapour overlap those of CO2 and other greenhouse gases. You can’t simply add greenhouse gas contributions together because addition is strongly nonlinear.
I need to check how that radiative forcing in Watts per square metre is calculated, and how the Annual greenhouse gas index is calculated. The most important point being that radiative forcing is proportional to the logarithm of concentration not proportional to concentration. See the following image for my favourite reference on this topic.

Date: 29/12/2023 12:18:46
From: Peak Warming Man
ID: 2108073
Subject: re: 3 questions for permeate-free (and anyone else)
mollwollfumble said:
PermeateFree said:
Why don’t you just google them. You will get more information than I and most people could give you of the top of our heads. Most people do not walk around with a very long list of facts and figures in the event of someone wanting to know. That is what books, etc. are for.
Googling is not the same as reading the scientific literature.
esselte said:
mollwollfumble said:
2. Back in the first and second IPCC scientific reports, it was stated that approximately 70% of global warming is due directly to atmospheric CO2 increases (without feedback amplification or effects of other greenhouse gases). That was in 1990, a long time ago. How much of global warming is directly due to atmospheric CO2 now, after 30 more years of detailed observation.
The atmospheric abundance and radiative forcing of the three main long-lived greenhouse gases (CO₂, CH₄, and N₂O) continue to increase. While the combined radiative forcing of these and all other greenhouse gases included in the AGGI rose 49% from 1990 to 2021 (by ~1.06 watts per square meter), carbon dioxide has accounted for about 80% of this increase (~0.85 watts per square meter), which makes it by far the biggest contributor to increases in climate forcing since 1990. Radiative forcing from methane has steadily increased since 2007, after having been nearly constant from 1999 to 2006. Owing to the Montreal Protocol, an international agreement signed in 1987, CFCs have been decreasing since the mid- to late 1990s after a long period of increase; however, the current warming influence from CFCs and related gases is still larger than that from HCFCs and HFCs. CFC replacements (HCFCs and HFCs) have been increasing since the phase-out of CFCs.
https://www.globalchange.gov/indicators/annual-greenhouse-gas-index
Lovely chart. I see that the radiative forcing from CFCs has shrunk, as I expected. I was not expecting the radiative forcing from HCFCs to have increased by that amount.
Due to tighter emission controls from vehicles, and the global introduction of catalytic converters, the radiative forcing from nitrous oxide should have shrunk, but it’s shown strong growth – I’ll have to look that that.
The radiative forcing from methane is close to constant, as expected.
The radiative forcing from carbon dioxide has increased enormously. Making it a much greater contributor to total radiative forcing. Up from 60% in 1979 to 67% in 2021.
The caveat here is that water vapour, over which we have no control, is the most important radiative forcer of all. And that water droplets in clouds is the most important cooling agent of all. Further, the absorption bands of water vapour overlap those of CO2 and other greenhouse gases. You can’t simply add greenhouse gas contributions together because addition is strongly nonlinear.
I need to check how that radiative forcing in Watts per square metre is calculated, and how the Annual greenhouse gas index is calculated. The most important point being that radiative forcing is proportional to the logarithm of concentration not proportional to concentration. See the following image for my favourite reference on this topic.
It’s above my pay grade but you appear to be doing some good work.
Date: 29/12/2023 12:29:05
From: ruby
ID: 2108080
Subject: re: 3 questions for permeate-free (and anyone else)
mollwollfumble said:
esselte said:
Radiative forcing from methane has steadily increased since 2007, after having been nearly constant from 1999 to 2006.
https://www.globalchange.gov/indicators/annual-greenhouse-gas-index
The radiative forcing from methane is close to constant, as expected.
Ahem
Date: 29/12/2023 13:04:31
From: wookiemeister
ID: 2108103
Subject: re: 3 questions for permeate-free (and anyone else)
Maybe you can remove methane from the atmosphere
Googling methane in the atmosphere
Methane rises to the stratosphere
You put up a large high altitude balloon with solar panels
You electrically heat a catalytic converter and air is pushed through it, methane and other pollutants are burnt or converted . It’s a cleaning mechanism for the atmosphere to remove more potent greenhouses gases
Date: 29/12/2023 13:07:33
From: wookiemeister
ID: 2108107
Subject: re: 3 questions for permeate-free (and anyone else)
wookiemeister said:
Maybe you can remove methane from the atmosphere
Googling methane in the atmosphere
Methane rises to the stratosphere
You put up a large high altitude balloon with solar panels
You electrically heat a catalytic converter and air is pushed through it, methane and other pollutants are burnt or converted . It’s a cleaning mechanism for the atmosphere to remove more potent greenhouses gases
You’d collect air using a pump so air passes through the catalytic converter at a flow and density so make sure an efficient reaction happens
Date: 29/12/2023 13:10:06
From: roughbarked
ID: 2108109
Subject: re: 3 questions for permeate-free (and anyone else)
wookiemeister said:
wookiemeister said:
Maybe you can remove methane from the atmosphere
Googling methane in the atmosphere
Methane rises to the stratosphere
You put up a large high altitude balloon with solar panels
You electrically heat a catalytic converter and air is pushed through it, methane and other pollutants are burnt or converted . It’s a cleaning mechanism for the atmosphere to remove more potent greenhouses gases
You’d collect air using a pump so air passes through the catalytic converter at a flow and density so make sure an efficient reaction happens
Have you calculated the size of all this?
Date: 29/12/2023 14:40:27
From: PermeateFree
ID: 2108178
Subject: re: 3 questions for permeate-free (and anyone else)
Moll said: >>Googling is not the same as reading the scientific literature.<<
Well that goes to show that you don’t use Google, otherwise you would know that if they did not contain the full paper, there would be an Abstract of it, especially on subjects with high reader interest. There are also listed and often linked references supplied either by the authors or by Google itself. In fact, Google is an excellent reference and generally can direct you to the information you seek from which your investigations would be greatly advanced if you used it instead of relying on something you read decades before.
Date: 29/12/2023 15:10:50
From: wookiemeister
ID: 2108194
Subject: re: 3 questions for permeate-free (and anyone else)
roughbarked said:
wookiemeister said:
wookiemeister said:
Maybe you can remove methane from the atmosphere
Googling methane in the atmosphere
Methane rises to the stratosphere
You put up a large high altitude balloon with solar panels
You electrically heat a catalytic converter and air is pushed through it, methane and other pollutants are burnt or converted . It’s a cleaning mechanism for the atmosphere to remove more potent greenhouses gases
You’d collect air using a pump so air passes through the catalytic converter at a flow and density so make sure an efficient reaction happens
Have you calculated the size of all this?
You are skimming a very narrow volume of the atmosphere. Clean , converted air flows out of a tube that hangs down from the zeppelin so you aren’t double handling the air. Doing something is better than doing nothing. Your solar cells would charge up a battery system during the day so night time converting could happen. You could have a flight crew and service techs wandering around making sure the system is kept functional
Date: 29/12/2023 15:14:11
From: wookiemeister
ID: 2108199
Subject: re: 3 questions for permeate-free (and anyone else)
The same airship could destroy CFCs in the atmosphere too
Date: 29/12/2023 15:27:20
From: Cymek
ID: 2108209
Subject: re: 3 questions for permeate-free (and anyone else)
wookiemeister said:
The same airship could destroy CFCs in the atmosphere too
And tell casual viewers its a parallel Earth
Date: 29/12/2023 17:41:46
From: mollwollfumble
ID: 2108265
Subject: re: 3 questions for permeate-free (and anyone else)
> An inconvenient truth
Yes, well. Some American vice presidents are infamous for having low intelligence.
This is all weasel words until you get near the end. Near the end a “collapse” of the Greenland ice sheet will cause a “flood” of refugees into America. That’s the political hook that everything else is based on. At current melting rates (0.13% in 26 years) the Greenland ice sheet will melt in 20,000 years, or less.
> https://www.globalchange.gov/indicators/annual-greenhouse-gas-index
Will get to this.
> Above my pay grade.
Unfortunately above mine as well. But I have read it cover to cover. And the methodology looks sound. Unfortunately the analysis in only for a single time, so I can’t use it to compare the progress over 30+ years.
> 1. When did the Scandinavian permanent ice-cap finally disappear?
I’ve seen estimates ranging from 500 BC all the way back to 10,000 BC.
> 3. I used to have a plot of sea level rise since 10,000 BC, based on coral growth data. But I lost the reference. What does the most recent version look like?
Date: 29/12/2023 17:44:36
From: Cymek
ID: 2108270
Subject: re: 3 questions for permeate-free (and anyone else)
mollwollfumble said:
> An inconvenient truth
Yes, well. Some American vice presidents are infamous for having low intelligence.
This is all weasel words until you get near the end. Near the end a “collapse” of the Greenland ice sheet will cause a “flood” of refugees into America. That’s the political hook that everything else is based on. At current melting rates (0.13% in 26 years) the Greenland ice sheet will melt in 20,000 years, or less.
> https://www.globalchange.gov/indicators/annual-greenhouse-gas-index
Will get to this.
> Above my pay grade.
Unfortunately above mine as well. But I have read it cover to cover. And the methodology looks sound. Unfortunately the analysis in only for a single time, so I can’t use it to compare the progress over 30+ years.
> 1. When did the Scandinavian permanent ice-cap finally disappear?
I’ve seen estimates ranging from 500 BC all the way back to 10,000 BC.
> 3. I used to have a plot of sea level rise since 10,000 BC, based on coral growth data. But I lost the reference. What does the most recent version look like?
Wouldn’t your people the mollwollfumblians have all this data about Earth
Date: 29/12/2023 18:34:34
From: PermeateFree
ID: 2108291
Subject: re: 3 questions for permeate-free (and anyone else)
Moll asked:
3. I used to have a plot of sea level rise since 10,000 BC, based on coral growth data. But I lost the reference. What does the most recent version look like?
The climate during the past 10,000 or so years (after the last Ice Age) has been remarkably stable which has permitted humanity to prosper. So with a reasonably consistent environment you would not expect any major changes to sealevels, which at this early stage of global warming change is why you can quote little sealevel movement and of lengthy periods of time for glacial change. However, it does not account for the accelerating and rapid changes taking place even over the past few years. You are being naive and/or dishonest to ignore these changes and the locked in future they represent.
Date: 29/12/2023 19:37:31
From: Spiny Norman
ID: 2108312
Subject: re: 3 questions for permeate-free (and anyone else)
PermeateFree said:
Moll asked:
3. I used to have a plot of sea level rise since 10,000 BC, based on coral growth data. But I lost the reference. What does the most recent version look like?
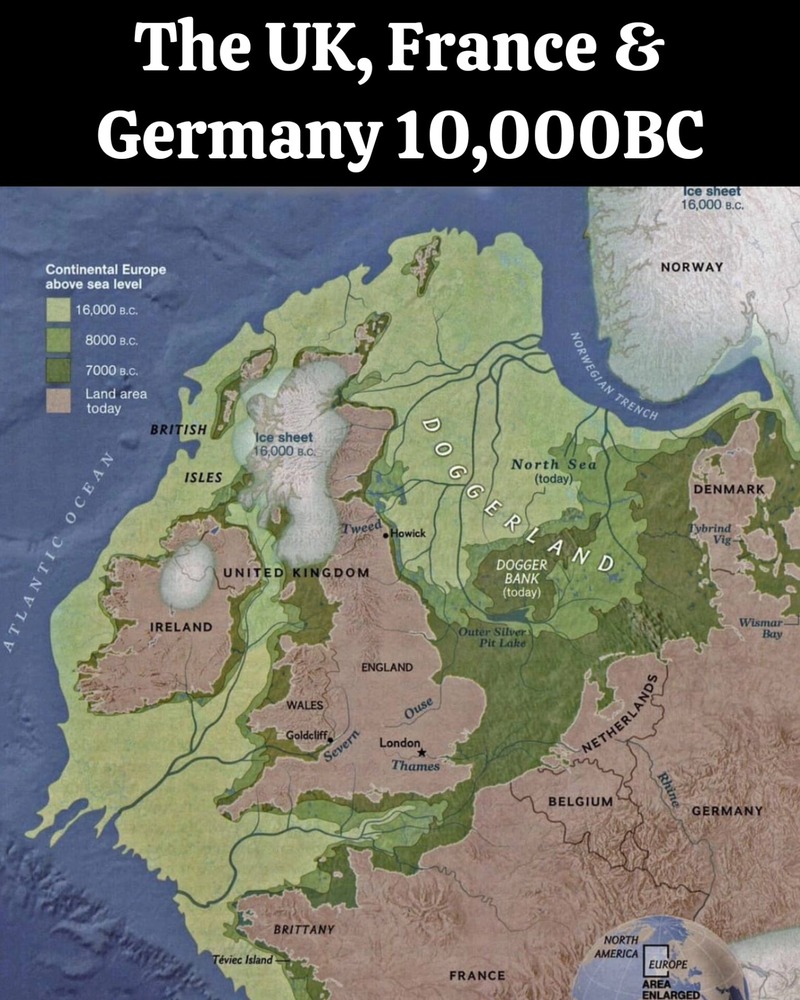
The climate during the past 10,000 or so years (after the last Ice Age) has been remarkably stable which has permitted humanity to prosper. So with a reasonably consistent environment you would not expect any major changes to sealevels, which at this early stage of global warming change is why you can quote little sealevel movement and of lengthy periods of time for glacial change. However, it does not account for the accelerating and rapid changes taking place even over the past few years. You are being naive and/or dishonest to ignore these changes and the locked in future they represent.
An example of sea level rise in the last few thousand years. A rather substantial reduction in land area.
Date: 29/12/2023 21:04:30
From: dv
ID: 2108334
Subject: re: 3 questions for permeate-free (and anyone else)
Spiny Norman said:
PermeateFree said:
Moll asked:
3. I used to have a plot of sea level rise since 10,000 BC, based on coral growth data. But I lost the reference. What does the most recent version look like?
The climate during the past 10,000 or so years (after the last Ice Age) has been remarkably stable which has permitted humanity to prosper. So with a reasonably consistent environment you would not expect any major changes to sealevels, which at this early stage of global warming change is why you can quote little sealevel movement and of lengthy periods of time for glacial change. However, it does not account for the accelerating and rapid changes taking place even over the past few years. You are being naive and/or dishonest to ignore these changes and the locked in future they represent.
An example of sea level rise in the last few thousand years. A rather substantial reduction in land area.
I own a nice book, actual dead tree format style, about the archaeology of Doggerland: originally just based on artefacts incidentally dredged up but now based on more systematic explorations. The land bridge from the Continent to Britain was cut by rising seas around 6500 BC but the uplands of Dogger bank did not completely submerge til about 5000 BC. This area is around 18 metres below sea level now. I sometimes wonder about the last Neolithic folk living there. The change would have been too slow for a single person to notice: the land just getting smaller, marshier and more inundated over generations until at some point it can’t support the tribe any more.
Date: 29/12/2023 21:52:34
From: PermeateFree
ID: 2108350
Subject: re: 3 questions for permeate-free (and anyone else)
Spiny Norman said:
PermeateFree said:
Moll asked:
3. I used to have a plot of sea level rise since 10,000 BC, based on coral growth data. But I lost the reference. What does the most recent version look like?
The climate during the past 10,000 or so years (after the last Ice Age) has been remarkably stable which has permitted humanity to prosper. So with a reasonably consistent environment you would not expect any major changes to sealevels, which at this early stage of global warming change is why you can quote little sealevel movement and of lengthy periods of time for glacial change. However, it does not account for the accelerating and rapid changes taking place even over the past few years. You are being naive and/or dishonest to ignore these changes and the locked in future they represent.
An example of sea level rise in the last few thousand years. A rather substantial reduction in land area.
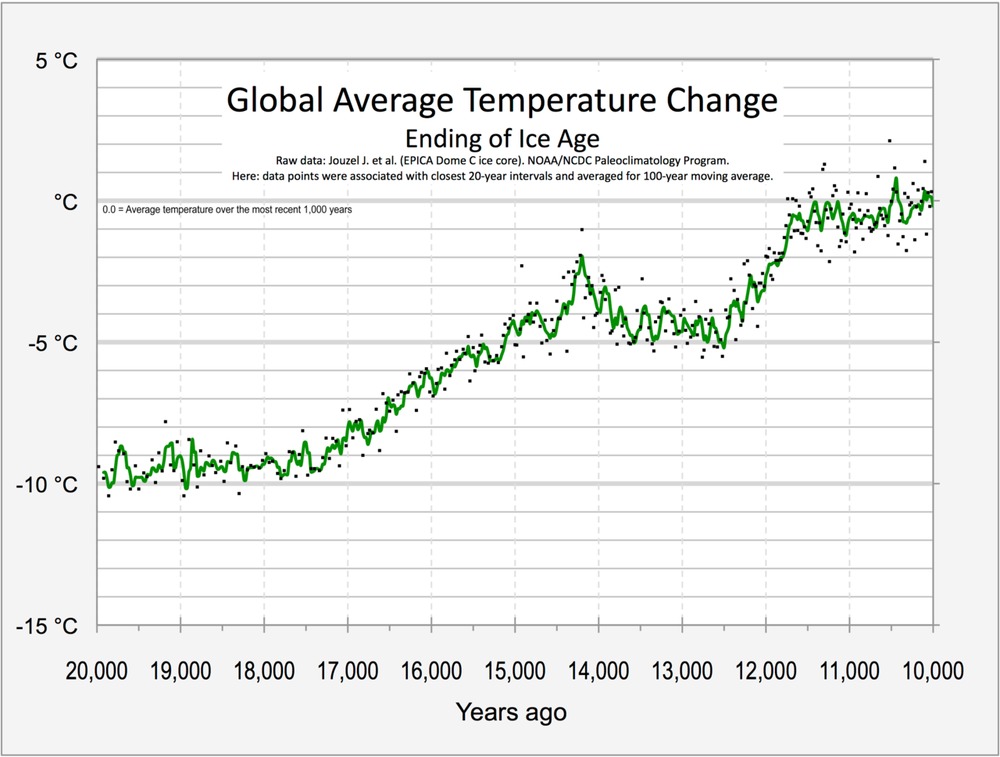
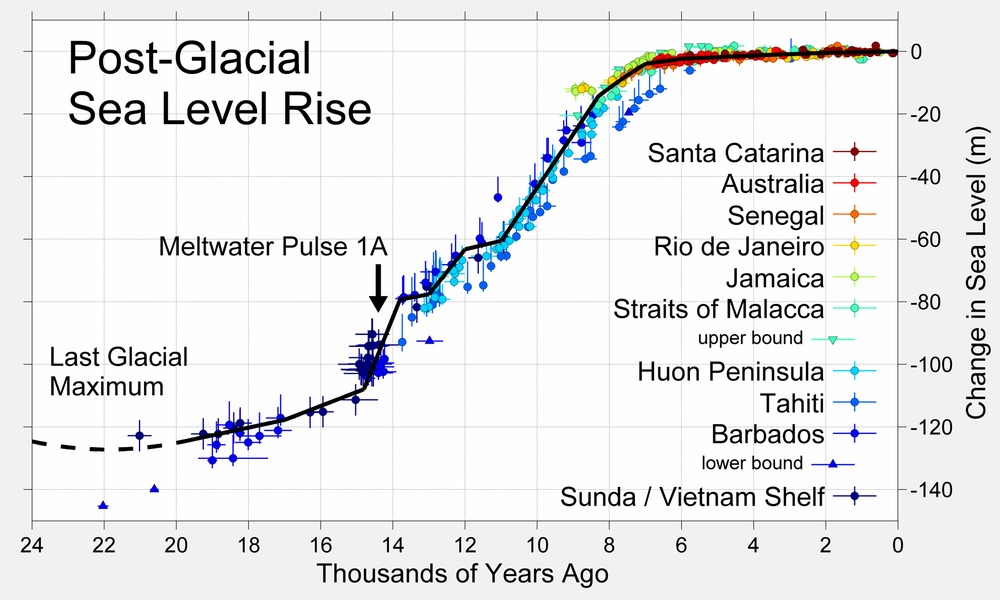
As can be seen the temperature rose around 11,000 years ago that ended the last ice age. However as can be seen by the maximum sealevel rise, it happened around 5,000 years later, presumably due to the melting of glaciers and other land-based icesheets.
Date: 30/12/2023 02:44:42
From: mollwollfumble
ID: 2108367
Subject: re: 3 questions for permeate-free (and anyone else)
3. Sea level rise.
PermeateFree said:
Excellent. Thank you PermeateFree. That’s the one I’m looking for, updated to a better version than the one I had seen before.
The sea level continued to rise until 6,000 years ago, 4,000 BC, and has been remarkably constant since then. Almost unnaturally stable. Even so, there are cities from antiquity that are beneath the sea. Port Royal and parts of Alexandria obviously. But also numerous cities along the coast of Turkey and nearby lands.
Even 6,000 years ago, the sea level was still about 1 metre below present the present level. Recent changes from human impact have been a massive 0.2 metres since 1880, i.e. over the past 140+ years. If we can hold to that sea level rise rate then it would be 700 years before the sea level rose one more metre. Which is relatively small compared to tsunamis which have been known on one occasion to exceed thirty metres.
> 1. Scandinavian ice sheet.
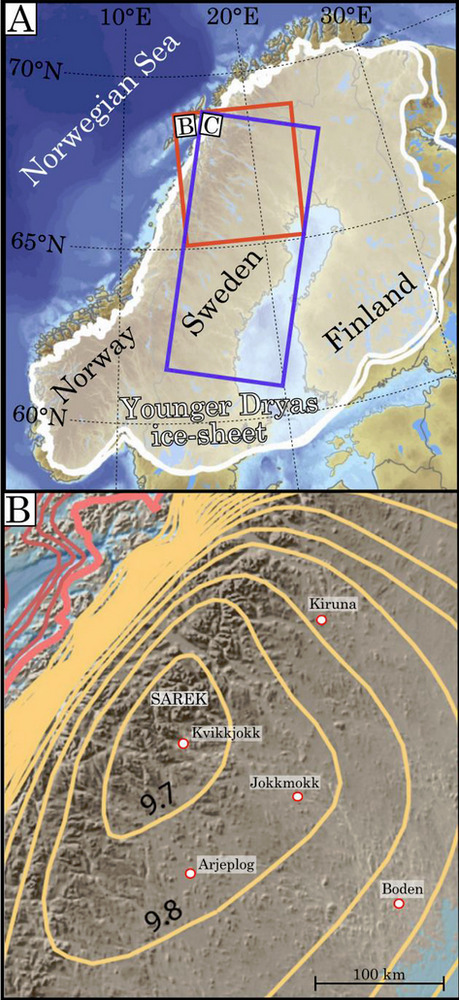
The ice sheet over Scandinavia caused vertical erosion in one place of “over 1,900 metres” deep of rock. That’s a lot of erosion!
Try Tracing the last remnants of the Scandinavian Ice Sheet: Ice-dammed lakes and a catastrophic outburst flood in northern Sweden
> The last Scandinavian Ice Sheet remnant was located east of the mountain range.
This figure gives 9,700 years ago for the end of the permanent ice sheet in Northern Sweden.
7,700 BC.
Date: 30/12/2023 08:56:10
From: roughbarked
ID: 2108373
Subject: re: 3 questions for permeate-free (and anyone else)
dv said:
Spiny Norman said:
PermeateFree said:
Moll asked:
3. I used to have a plot of sea level rise since 10,000 BC, based on coral growth data. But I lost the reference. What does the most recent version look like?
The climate during the past 10,000 or so years (after the last Ice Age) has been remarkably stable which has permitted humanity to prosper. So with a reasonably consistent environment you would not expect any major changes to sealevels, which at this early stage of global warming change is why you can quote little sealevel movement and of lengthy periods of time for glacial change. However, it does not account for the accelerating and rapid changes taking place even over the past few years. You are being naive and/or dishonest to ignore these changes and the locked in future they represent.
An example of sea level rise in the last few thousand years. A rather substantial reduction in land area.
I own a nice book, actual dead tree format style, about the archaeology of Doggerland: originally just based on artefacts incidentally dredged up but now based on more systematic explorations. The land bridge from the Continent to Britain was cut by rising seas around 6500 BC but the uplands of Dogger bank did not completely submerge til about 5000 BC. This area is around 18 metres below sea level now. I sometimes wonder about the last Neolithic folk living there. The change would have been too slow for a single person to notice: the land just getting smaller, marshier and more inundated over generations until at some point it can’t support the tribe any more.
Apparently they were a dogged lot.
Date: 30/12/2023 11:26:25
From: mollwollfumble
ID: 2108412
Subject: re: 3 questions for permeate-free (and anyone else)
dv said:
I own a nice book, actual dead tree format style, about the archaeology of Doggerland: originally just based on artefacts incidentally dredged up but now based on more systematic explorations. The land bridge from the Continent to Britain was cut by rising seas around 6500 BC but the uplands of Dogger bank did not completely submerge til about 5000 BC. This area is around 18 metres below sea level now. I sometimes wonder about the last Neolithic folk living there. The change would have been too slow for a single person to notice: the land just getting smaller, marshier and more inundated over generations until at some point it can’t support the tribe any more.
Do you have a title for that? I’d like to buy it.
The book about undersea archaeology around Turkey and elsewhere is just called “Underwater archaeology”, it’s been many decades since I read it.
> https://www.globalchange.gov/indicators/annual-greenhouse-gas-index
Will get to this.
>> https://tokyo3.org/uploads/760b816b-5882-49ad-ae17-98e5fee62711.png
>> Above my pay grade.
> Unfortunately above mine as well. But I have read it cover to cover. And the methodology looks sound. Unfortunately the analysis in only for a single time, so I can’t use it to compare the progress over 30+ years.
On the other hand, perhaps I can simplify it. If, instead of computing the CO2 effect from the thousands of spectral lines, I concentrate on the one dominant absorption line at … no, not good enough, multiple nearby spectral lines contribute.
But if I copy the CO2 radiation absorption curve for a single CO2 concentration from that paper onto a spreadsheet, then I can use simple rules of optical absorption to modify that for a sufficiently large range of CO2 concentrations. For example, suppose CO2 blocks x% of radiation at a specific frequency at concentration 1. Then at concentration y it will block 100*(1-(1-x/100)^y) of radiation. Integrate the result over all relevant frequencies to get the total absorption vs concentration.
That’s in the absence of water vapour absorption at that frequency. In the presence of water vapour absorption w% at that frequency it becomes, um, what?
Then there’s the equation for calculating global warming from radiation absorption. It’s got a sigma*T^4 in it where sigma is the Stefan-Boltzmann constant. As well as an albedo and emissivity epsilon.
Dang it, this used to be easy when I was younger.
Date: 30/12/2023 11:32:35
From: roughbarked
ID: 2108413
Subject: re: 3 questions for permeate-free (and anyone else)
mollwollfumble said:
Dang it, this used to be easy when I was younger.
Everything was easier when I was younger.
Date: 30/12/2023 11:46:03
From: Kingy
ID: 2108417
Subject: re: 3 questions for permeate-free (and anyone else)
dv said:
Spiny Norman said:
PermeateFree said:
Moll asked:
3. I used to have a plot of sea level rise since 10,000 BC, based on coral growth data. But I lost the reference. What does the most recent version look like?
The climate during the past 10,000 or so years (after the last Ice Age) has been remarkably stable which has permitted humanity to prosper. So with a reasonably consistent environment you would not expect any major changes to sealevels, which at this early stage of global warming change is why you can quote little sealevel movement and of lengthy periods of time for glacial change. However, it does not account for the accelerating and rapid changes taking place even over the past few years. You are being naive and/or dishonest to ignore these changes and the locked in future they represent.
An example of sea level rise in the last few thousand years. A rather substantial reduction in land area.
I own a nice book, actual dead tree format style, about the archaeology of Doggerland: originally just based on artefacts incidentally dredged up but now based on more systematic explorations. The land bridge from the Continent to Britain was cut by rising seas around 6500 BC but the uplands of Dogger bank did not completely submerge til about 5000 BC. This area is around 18 metres below sea level now. I sometimes wonder about the last Neolithic folk living there. The change would have been too slow for a single person to notice: the land just getting smaller, marshier and more inundated over generations until at some point it can’t support the tribe any more.
There was a massive undersea landslide off Norway that created a tsunami which wiped out the last doggerland inhabitants.
Date: 30/12/2023 11:52:33
From: Michael V
ID: 2108419
Subject: re: 3 questions for permeate-free (and anyone else)
Kingy said:
dv said:
Spiny Norman said:
An example of sea level rise in the last few thousand years. A rather substantial reduction in land area.
I own a nice book, actual dead tree format style, about the archaeology of Doggerland: originally just based on artefacts incidentally dredged up but now based on more systematic explorations. The land bridge from the Continent to Britain was cut by rising seas around 6500 BC but the uplands of Dogger bank did not completely submerge til about 5000 BC. This area is around 18 metres below sea level now. I sometimes wonder about the last Neolithic folk living there. The change would have been too slow for a single person to notice: the land just getting smaller, marshier and more inundated over generations until at some point it can’t support the tribe any more.
There was a massive undersea landslide off Norway that created a tsunami which wiped out the last doggerland inhabitants.
https://en.wikipedia.org/wiki/Storegga_Slide#Impact_on_human_populations
Date: 30/12/2023 12:01:22
From: roughbarked
ID: 2108422
Subject: re: 3 questions for permeate-free (and anyone else)
Michael V said:
Kingy said:
dv said:
I own a nice book, actual dead tree format style, about the archaeology of Doggerland: originally just based on artefacts incidentally dredged up but now based on more systematic explorations. The land bridge from the Continent to Britain was cut by rising seas around 6500 BC but the uplands of Dogger bank did not completely submerge til about 5000 BC. This area is around 18 metres below sea level now. I sometimes wonder about the last Neolithic folk living there. The change would have been too slow for a single person to notice: the land just getting smaller, marshier and more inundated over generations until at some point it can’t support the tribe any more.
There was a massive undersea landslide off Norway that created a tsunami which wiped out the last doggerland inhabitants.
https://en.wikipedia.org/wiki/Storegga_Slide#Impact_on_human_populations
From that, this: While the tsunami caused by the Second Storegga Slide would have been devastating for those within the run-in zone, ultimately the tsunami was neither universally catastrophic nor the reason behind the inundation of the last vestiges of Doggerland.
Date: 30/12/2023 17:49:36
From: wookiemeister
ID: 2108560
Subject: re: 3 questions for permeate-free (and anyone else)
Interesting
My solar system and battery system has saved 15 tonnes of carbon dioxide
From an emissions perspective john cadogan says a residential solar system/ battery system is more efficient in reducing CO2 output.
Date: 31/12/2023 01:51:45
From: mollwollfumble
ID: 2108659
Subject: re: 3 questions for permeate-free (and anyone else)
mollwollfumble said:
dv said:
I own a nice book, actual dead tree format style, about the archaeology of Doggerland: originally just based on artefacts incidentally dredged up but now based on more systematic explorations. The land bridge from the Continent to Britain was cut by rising seas around 6500 BC but the uplands of Dogger bank did not completely submerge til about 5000 BC. This area is around 18 metres below sea level now. I sometimes wonder about the last Neolithic folk living there. The change would have been too slow for a single person to notice: the land just getting smaller, marshier and more inundated over generations until at some point it can’t support the tribe any more.
Do you have a title for that? I’d like to buy it.
The book about undersea archaeology around Turkey and elsewhere is just called “Underwater archaeology”, it’s been many decades since I read it.
> https://www.globalchange.gov/indicators/annual-greenhouse-gas-index
Will get to this.
>> https://tokyo3.org/uploads/760b816b-5882-49ad-ae17-98e5fee62711.png
>> Above my pay grade.
> Unfortunately above mine as well. But I have read it cover to cover. And the methodology looks sound. Unfortunately the analysis in only for a single time, so I can’t use it to compare the progress over 30+ years.
On the other hand, perhaps I can simplify it. If, instead of computing the CO2 effect from the thousands of spectral lines, I concentrate on the one dominant absorption line at … no, not good enough, multiple nearby spectral lines contribute.
But if I copy the CO2 radiation absorption curve for a single CO2 concentration from that paper onto a spreadsheet, then I can use simple rules of optical absorption to modify that for a sufficiently large range of CO2 concentrations. For example, suppose CO2 blocks x% of radiation at a specific frequency at concentration 1. Then at concentration y it will block 100*(1-(1-x/100)^y) of radiation. Integrate the result over all relevant frequencies to get the total absorption vs concentration.
That’s in the absence of water vapour absorption at that frequency. In the presence of water vapour absorption w% at that frequency it becomes, um, what?
Then there’s the equation for calculating global warming from radiation absorption. It’s got a sigma*T^4 in it where sigma is the Stefan-Boltzmann constant. As well as an albedo and emissivity epsilon.
Dang it, this used to be easy when I was younger.
(1-w/100)*100*(1-(1-x/100/(1-w/100))^y)
At least I got that far. Check, value of expression when y=1 reduces to x. Good.
When I integrate that, is it integral over wavelength, frequency, log wavelength or log frequency. It makes a difference, the original paper should tell me. It does, integrate over frequency.
Now what’s that equation for global warming as a function of radiative heat flux? It should be in wikipedia, or failing that in the first IPCC report.
Let’s see if this works, from https://www.sciencedirect.com/science/article/pii/S2214157×22009145
(1 – ρ)E_cA_d = AsεσT_e⁴
Date: 31/12/2023 02:53:51
From: dv
ID: 2108660
Subject: re: 3 questions for permeate-free (and anyone else)
mollwollfumble said:
Do you have a title for that? I’d like to buy it.
Europe’s Lost World: The rediscovery of Doggerland
by V Gaffney, S Fitch and D Smith
with a foreward by Tony Robinson
Date: 4/01/2024 21:11:16
From: dv
ID: 2110523
Subject: re: 3 questions for permeate-free (and anyone else)
Date: 4/01/2024 21:17:21
From: ChrispenEvan
ID: 2110524
Subject: re: 3 questions for permeate-free (and anyone else)
dv said:
How dry was it?
Dry as.
LTJTB