Date: 15/08/2015 06:45:57
From: mollwollfumble
ID: 761509
Subject: HR diagram
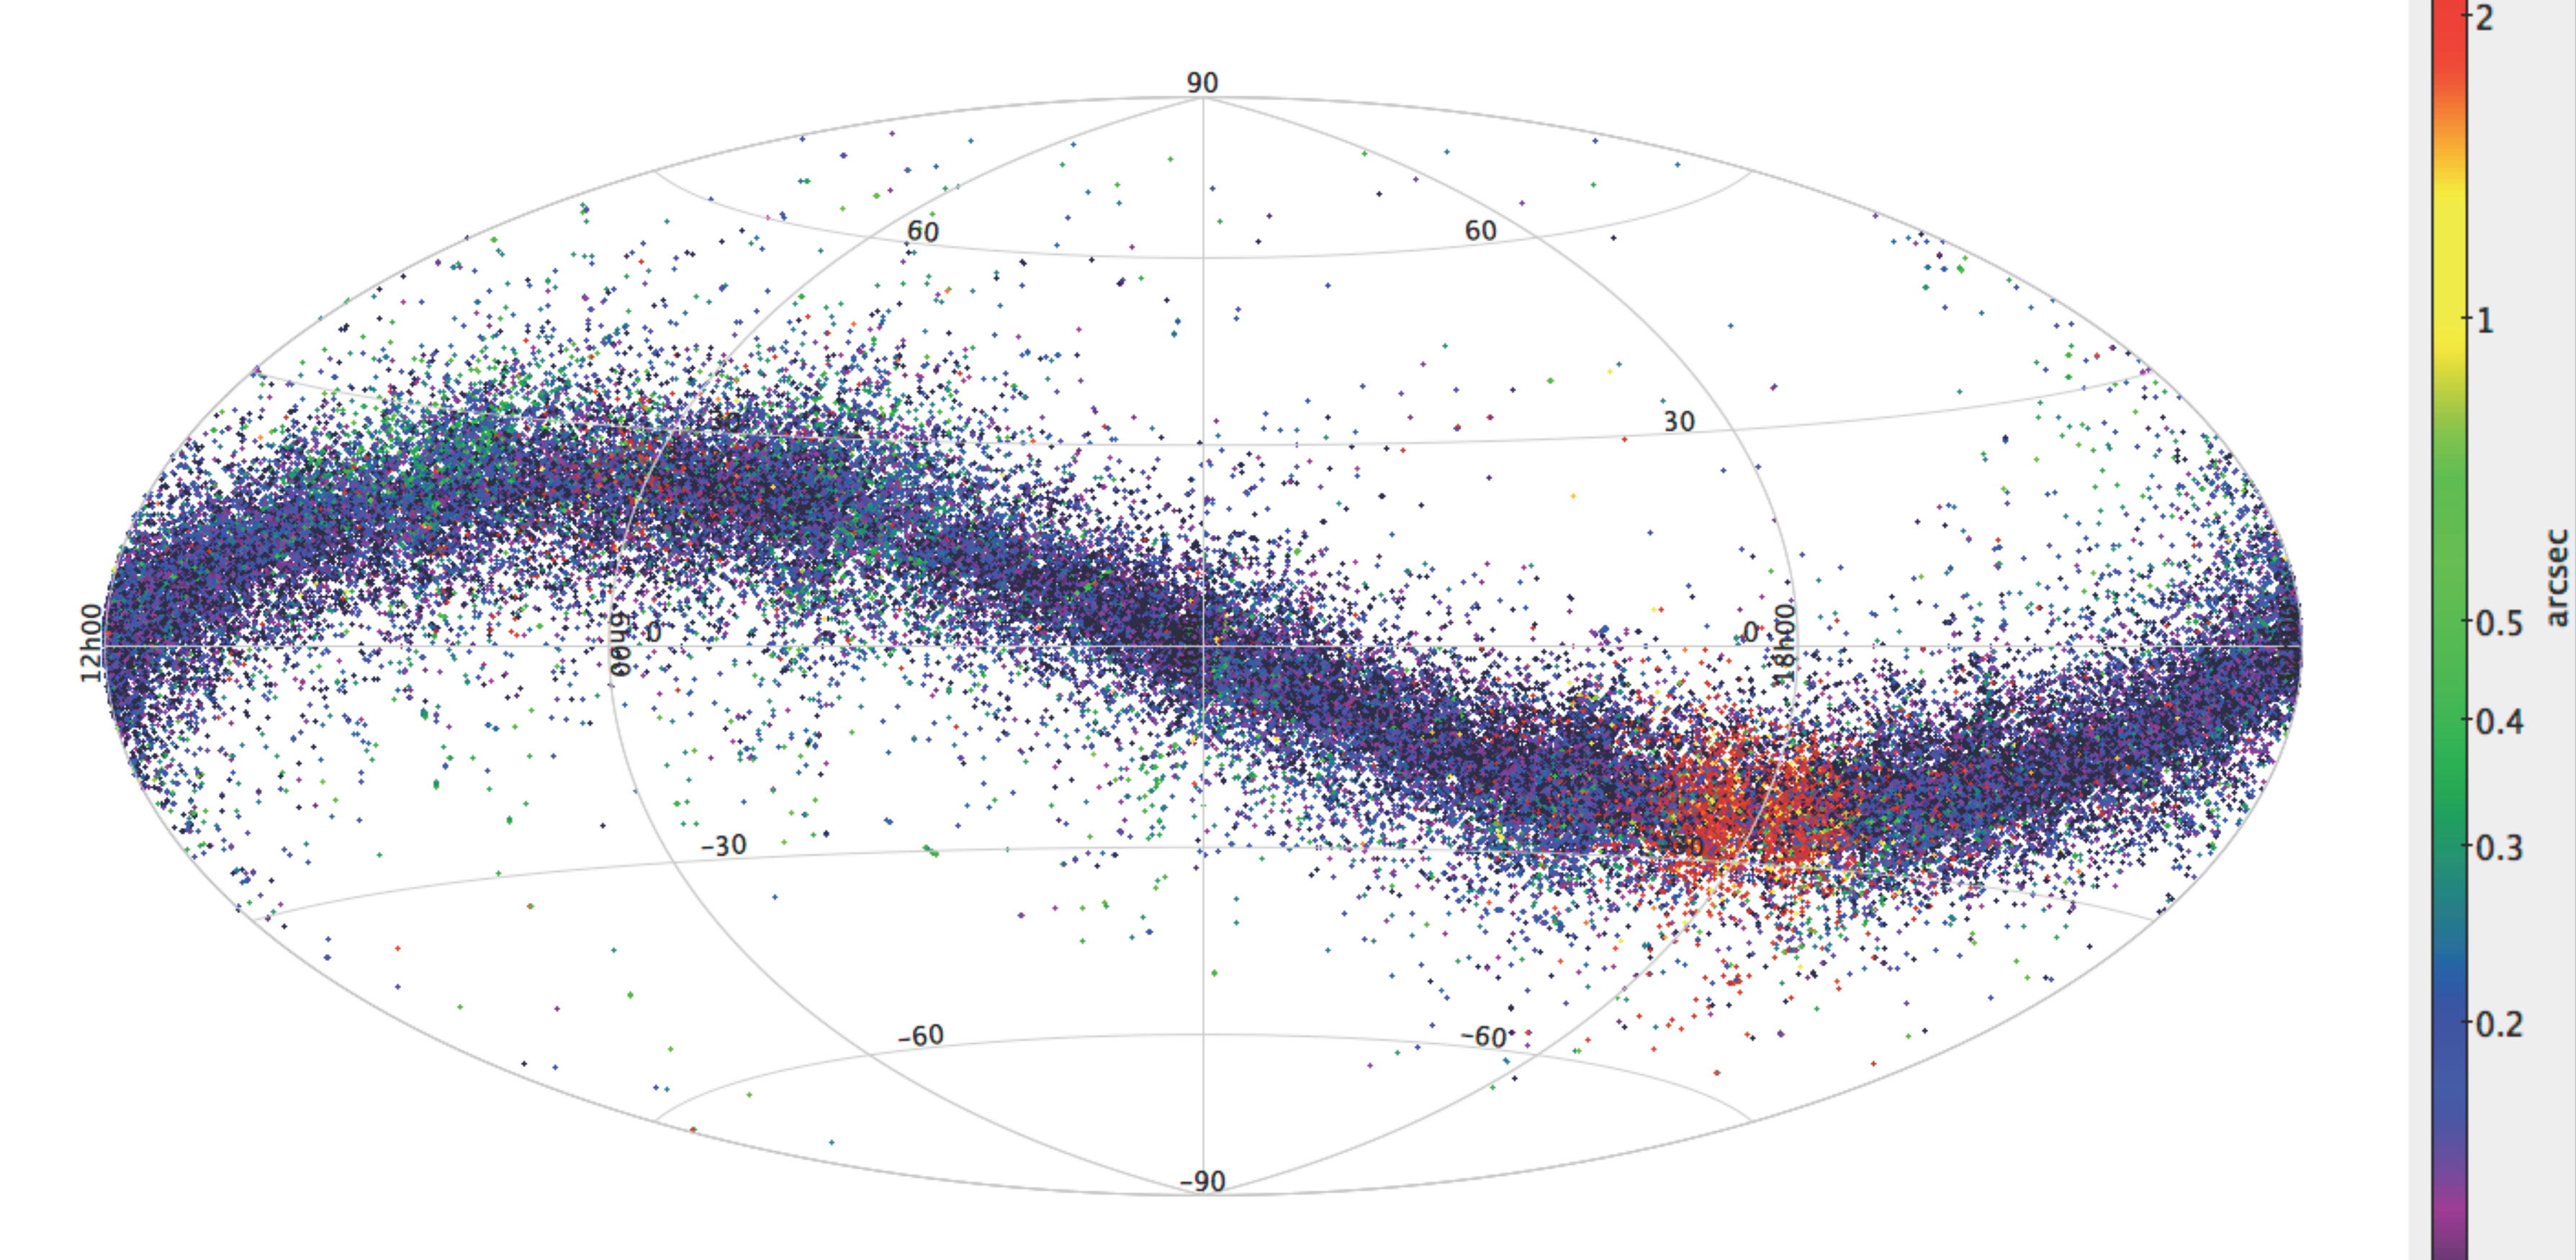
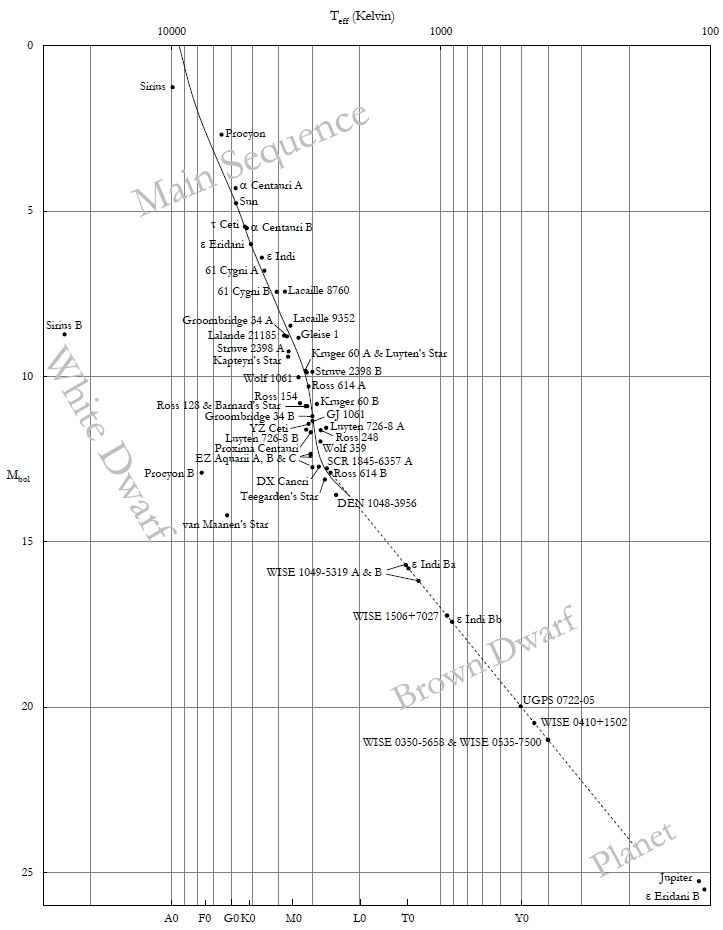
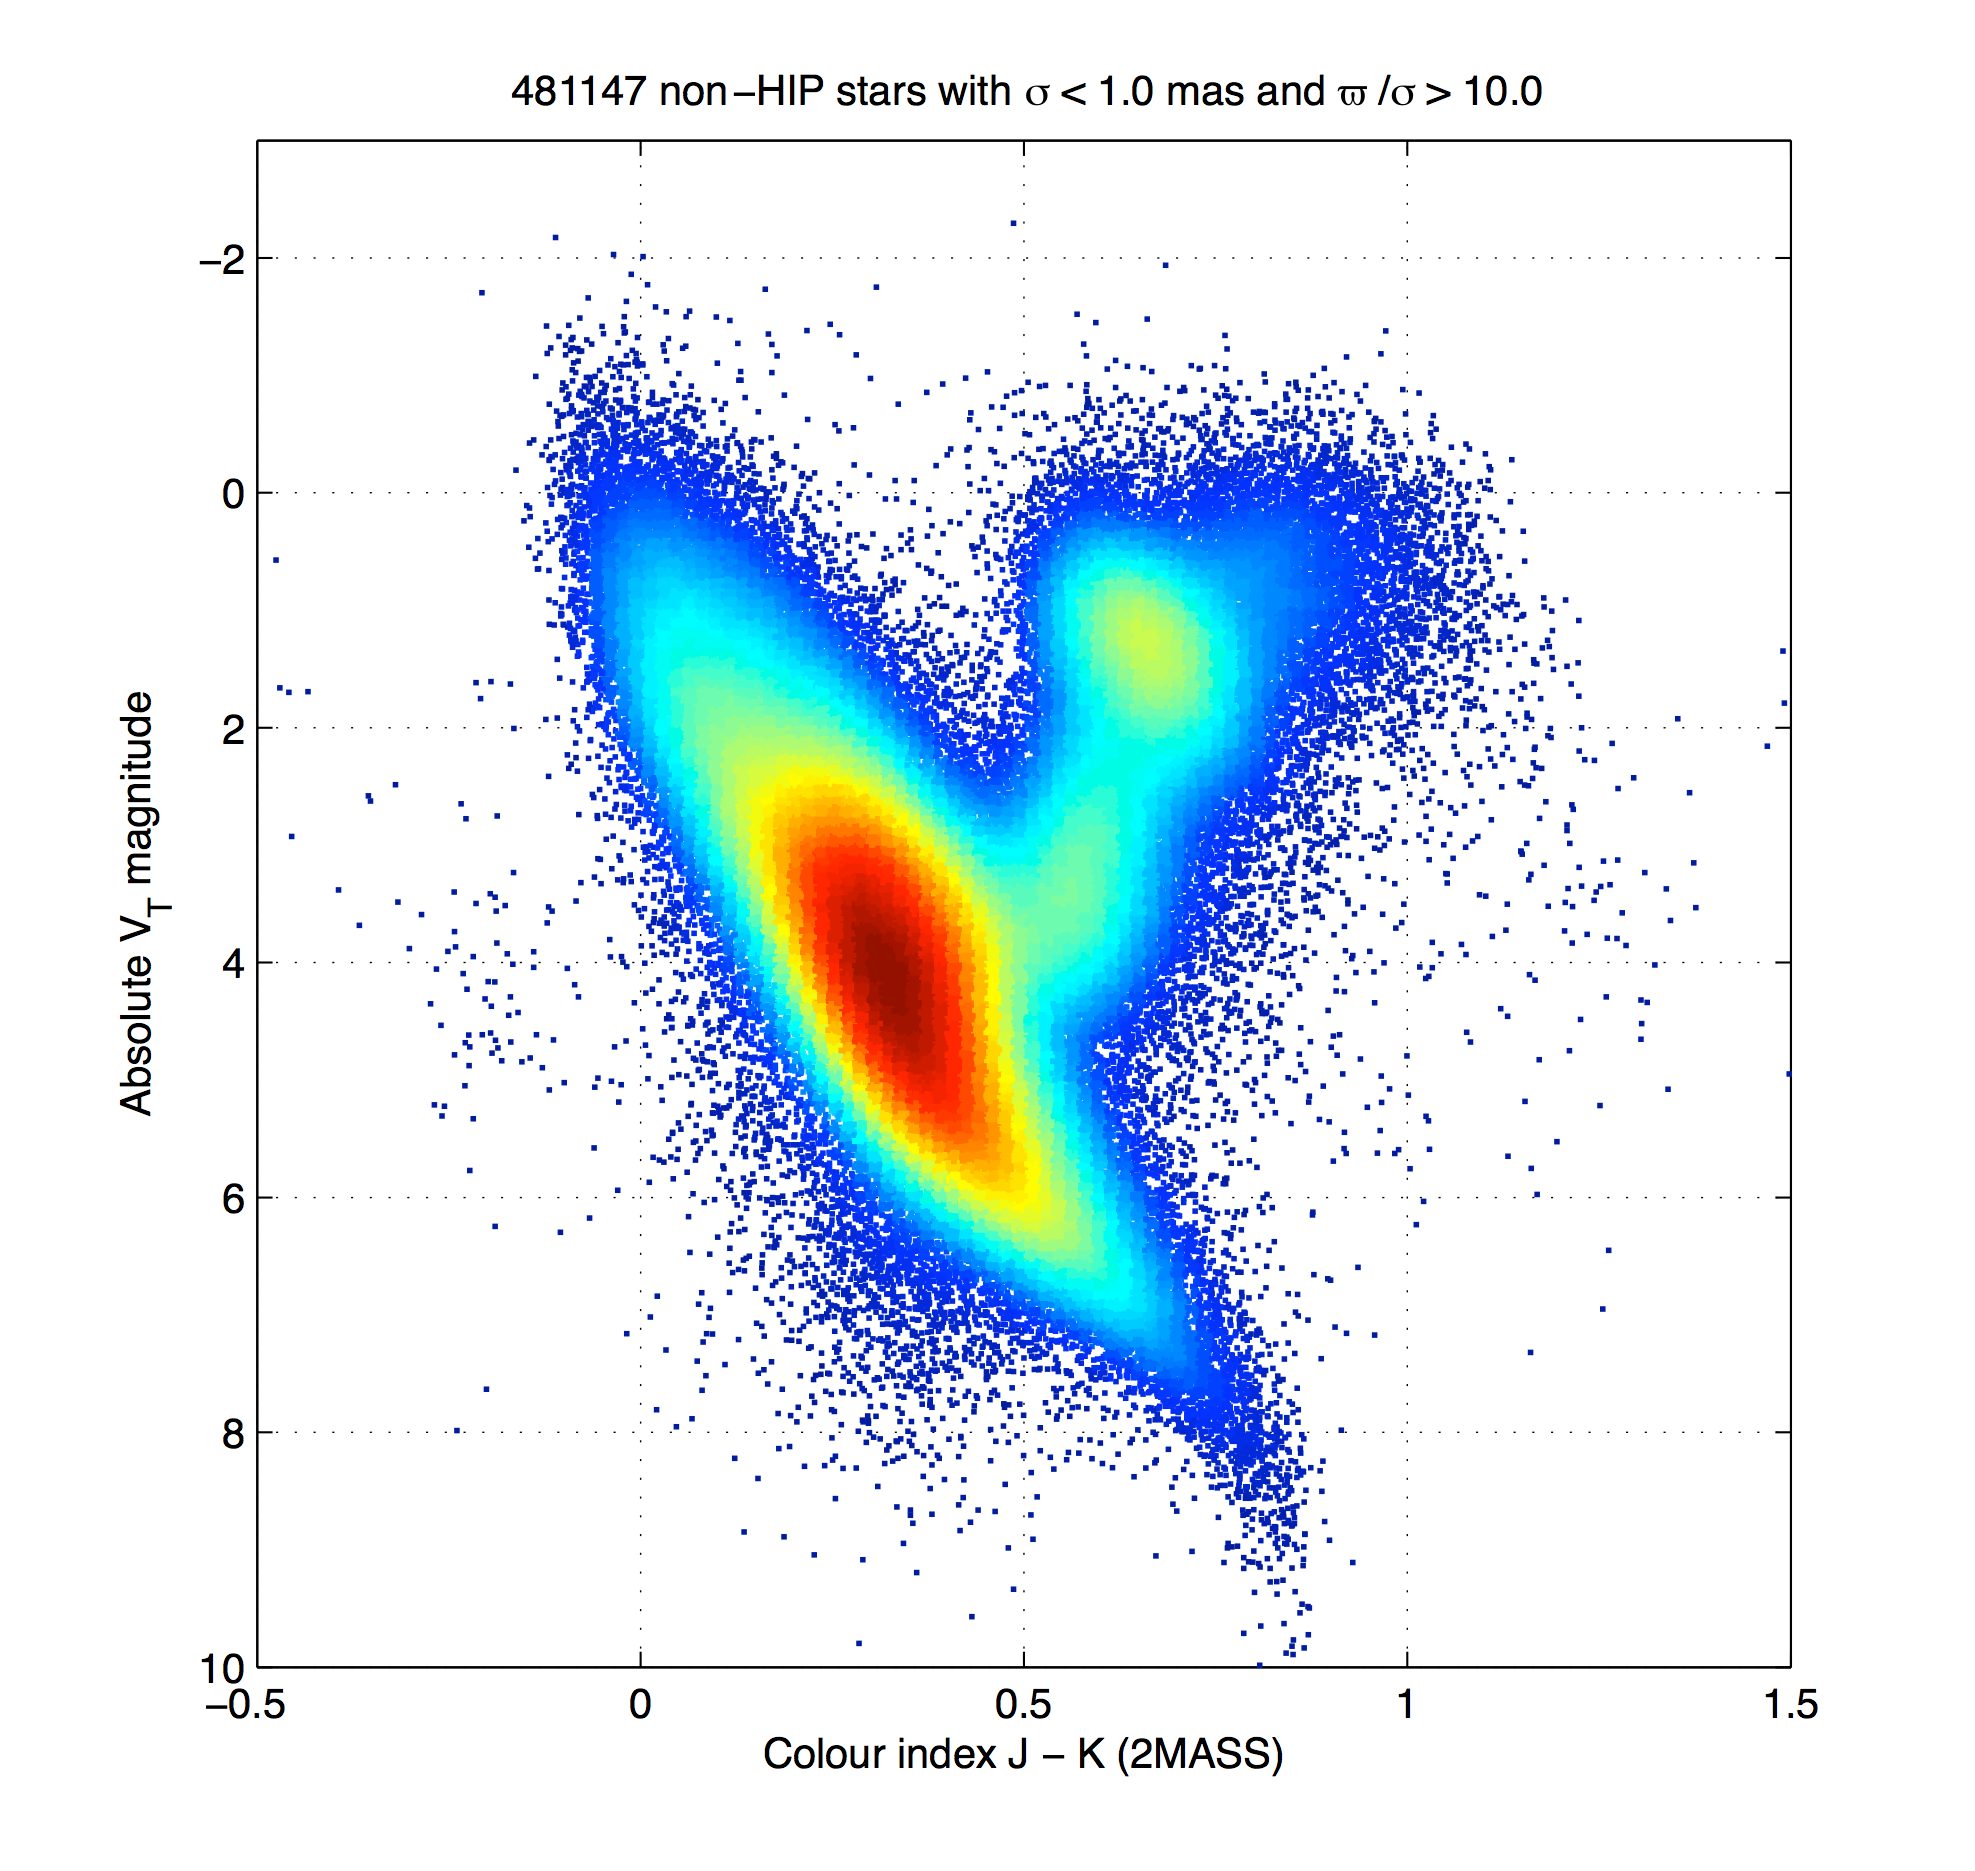
The following figure is the HR diagram for the 481,000 nearest stars. As measured by spacecraft Gaia. I find the bunch of stars directly under the centre of the main sequence unexpected (these are yellow stars, so not white dwarfs or red dwarfs). I also find the bunch of stars to the right and slightly above the red giants unexpected. What are we looking at in both cases?
Article
http://www.cosmos.esa.int/web/gaia/news_20150807
Larger copy of image on http://www.cosmos.esa.int/documents/29201/652054/20150807bb.png/b0f21c56-2af5-4883-981b-963ec2422aab?t=1438827414281