Date: 16/06/2016 21:46:56
From: mollwollfumble
ID: 908913
Subject: Global climate question
I need to program the global climate into a spreadsheet. As accurate as possible.
How?
Need temperatures, temperature variations (day-night, summer-winter), and either humidity or dewpoint.
Date: 16/06/2016 21:51:02
From: mollwollfumble
ID: 908914
Subject: re: Global climate question
mollwollfumble said:
I need to program the global climate into a spreadsheet. As accurate as possible.
How?
Need temperatures, temperature variations (day-night, summer-winter), and either humidity or dewpoint.
Also need altitude.
Date: 16/06/2016 21:52:45
From: buffy
ID: 908916
Subject: re: Global climate question
Date: 16/06/2016 21:52:53
From: dv
ID: 908917
Subject: re: Global climate question
mollwollfumble said:
I need to program the global climate into a spreadsheet. As accurate as possible.
How?
Need temperatures, temperature variations (day-night, summer-winter), and either humidity or dewpoint.
ROFL
Date: 16/06/2016 22:31:49
From: mollwollfumble
ID: 908924
Subject: re: Global climate question
dv said:
mollwollfumble said:
I need to program the global climate into a spreadsheet. As accurate as possible.
How?
Need temperatures, temperature variations (day-night, summer-winter), and either humidity or dewpoint. And altitude.
ROFL
Serious. Is needed for calculating corrosion of passenger and military aircraft as a function of flight paths between airports.
Date: 16/06/2016 22:32:39
From: dv
ID: 908925
Subject: re: Global climate question
mollwollfumble said:
dv said:
mollwollfumble said:
I need to program the global climate into a spreadsheet. As accurate as possible.
How?
Need temperatures, temperature variations (day-night, summer-winter), and either humidity or dewpoint. And altitude.
ROFL
Serious. Is needed for calculating corrosion of passenger and military aircraft as a function of flight paths between airports.
I’m not sure what sort of answer you’re expecting. You’ll need to obtain this data from various weather and climate agencies.
Date: 16/06/2016 22:52:26
From: roughbarked
ID: 908927
Subject: re: Global climate question
dv said:
mollwollfumble said:
dv said:
ROFL
Serious. Is needed for calculating corrosion of passenger and military aircraft as a function of flight paths between airports.
I’m not sure what sort of answer you’re expecting. You’ll need to obtain this data from various weather and climate agencies.
I’d think that the planes these days log all that data and send it back to the airline and the weather/climate agencies.
Date: 17/06/2016 05:03:37
From: mollwollfumble
ID: 908992
Subject: re: Global climate question
dv said:
mollwollfumble said:
dv said:
ROFL
Serious. Is needed for calculating corrosion of passenger and military aircraft as a function of flight paths between airports.
I’m not sure what sort of answer you’re expecting. You’ll need to obtain this data from various weather and climate agencies.
There may be ten or more different ways to do this. I’m hoping for insights from you into which way may be the quickest and most accurate.
Date: 17/06/2016 06:34:06
From: Spiny Norman
ID: 908993
Subject: re: Global climate question
mollwollfumble said:
dv said:
mollwollfumble said:
Serious. Is needed for calculating corrosion of passenger and military aircraft as a function of flight paths between airports.
I’m not sure what sort of answer you’re expecting. You’ll need to obtain this data from various weather and climate agencies.
There may be ten or more different ways to do this. I’m hoping for insights from you into which way may be the quickest and most accurate.
Ask Steve on Facepalm. He, if anyone, should know.
Date: 17/06/2016 06:45:19
From: wookiemeister
ID: 908995
Subject: re: Global climate question
aircraft spend more time on the ground than in the air
Date: 17/06/2016 06:47:12
From: wookiemeister
ID: 908996
Subject: re: Global climate question
put an airport near the ocean and you’d have more corrosion
Date: 17/06/2016 07:44:44
From: Spiny Norman
ID: 909001
Subject: re: Global climate question
wookiemeister said:
aircraft spend more time on the ground than in the air
Depends on the aircraft, the company and the route. I worked the Hajj once, and the planes were in the air nearly 20 hours a day.
Most of the domestic stuff does spend more time on the ground though, yes.
Date: 17/06/2016 08:07:50
From: Peak Warming Man
ID: 909006
Subject: re: Global climate question
Morning punters and correctors.
Mild morning with scattered showers.
The Weather Bureau is predicting another catastrophic event coming up but they now rely on advertising and clicks for funding so they are always beating up the forcasts now to attract punters.
Date: 17/06/2016 10:26:53
From: The Rev Dodgson
ID: 909055
Subject: re: Global climate question
dv said:
mollwollfumble said:
I need to program the global climate into a spreadsheet. As accurate as possible.
How?
Need temperatures, temperature variations (day-night, summer-winter), and either humidity or dewpoint.
ROFL
Not sure why it gets a ROFL, but I’m also not sure what you are after.
Do you want to import the data, and have an efficient way to access it along a specified flight path, or are you wanting to query existing data bases on the Internet, or elsewhere?
Date: 17/06/2016 10:28:22
From: dv
ID: 909057
Subject: re: Global climate question
The Rev Dodgson said:
dv said:
mollwollfumble said:
I need to program the global climate into a spreadsheet. As accurate as possible.
How?
Need temperatures, temperature variations (day-night, summer-winter), and either humidity or dewpoint.
ROFL
Not sure why it gets a ROFL, but I’m also not sure what you are after.
Do you want to import the data, and have an efficient way to access it along a specified flight path, or are you wanting to query existing data bases on the Internet, or elsewhere?
It gets a ROFL because on the face of it it seems he wants us to do a few hours of research for him…
Date: 17/06/2016 10:29:46
From: The Rev Dodgson
ID: 909058
Subject: re: Global climate question
dv said:
The Rev Dodgson said:
dv said:
ROFL
Not sure why it gets a ROFL, but I’m also not sure what you are after.
Do you want to import the data, and have an efficient way to access it along a specified flight path, or are you wanting to query existing data bases on the Internet, or elsewhere?
It gets a ROFL because on the face of it it seems he wants us to do a few hours of research for him…
OK then.
I thought you might be doubting the near infinite power of the spreadsheet :)
Date: 17/06/2016 10:31:13
From: diddly-squat
ID: 909061
Subject: re: Global climate question
The Rev Dodgson said:
dv said:
The Rev Dodgson said:
Not sure why it gets a ROFL, but I’m also not sure what you are after.
Do you want to import the data, and have an efficient way to access it along a specified flight path, or are you wanting to query existing data bases on the Internet, or elsewhere?
It gets a ROFL because on the face of it it seems he wants us to do a few hours of research for him…
OK then.
I thought you might be doubting the near infinite power of the spreadsheet :)
=iserror(“near infinite”)
Date: 17/06/2016 10:49:24
From: Peak Warming Man
ID: 909065
Subject: re: Global climate question
diddly-squat said:
The Rev Dodgson said:
dv said:
It gets a ROFL because on the face of it it seems he wants us to do a few hours of research for him…
OK then.
I thought you might be doubting the near infinite power of the spreadsheet :)
=iserror(“near infinite”)
I think TRD and Diddly are sinking away from reality and into the dark world of Spreadsheets, a world of rows and columns and mysterious runes in fields.
Date: 17/06/2016 10:53:02
From: diddly-squat
ID: 909066
Subject: re: Global climate question
Peak Warming Man said:
diddly-squat said:
The Rev Dodgson said:
OK then.
I thought you might be doubting the near infinite power of the spreadsheet :)
=iserror(“near infinite”)
I think TRD and Diddly are sinking away from reality and into the dark world of Spreadsheets, a world of rows and columns and mysterious runes in fields.
TRD is level 5000 UDF
Date: 17/06/2016 11:50:36
From: Witty Rejoinder
ID: 909073
Subject: re: Global climate question
dv said:
It gets a ROFL because on the face of it it seems he wants us to do a few hours of research for him…
You’ll do what you’re told!
Date: 17/06/2016 12:25:25
From: mollwollfumble
ID: 909074
Subject: re: Global climate question
The Rev Dodgson said:
dv said:
mollwollfumble said:
I need to program the global climate into a spreadsheet. As accurate as possible.
How?
Need temperatures, temperature variations (day-night, summer-winter), and either humidity or dewpoint.
ROFL
Not sure why it gets a ROFL, but I’m also not sure what you are after.
Do you want to import the data, and have an efficient way to access it along a specified flight path, or are you wanting to query existing data bases on the Internet, or elsewhere?
I’m working with a Fortran programmer on this, apparently there are more than two of us in the world! Best way to input data to Fortran is a csv or tab delimited text file which is easily produced from spreadsheet, and spreadsheet is superb for manipulating the data before .csv production.
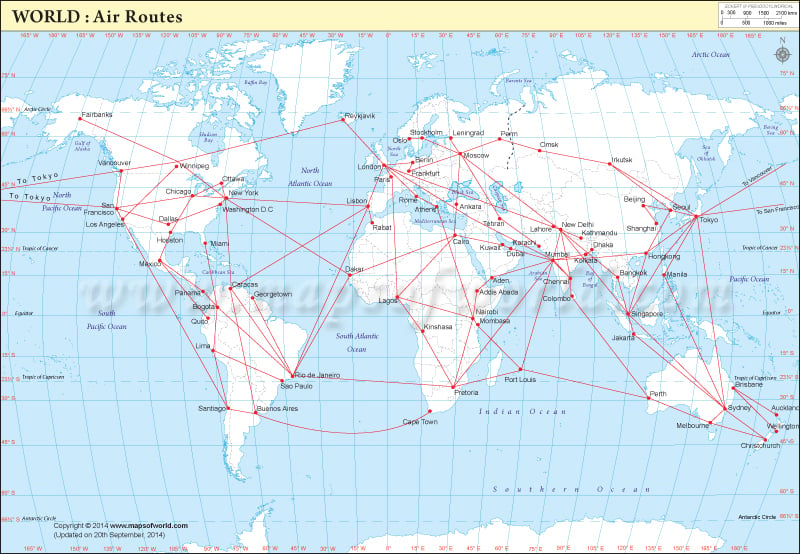
Input would be a list of flight routes the aircraft either has or would be expected to traverse (two three-letter airport codes), together with estimated duration, time of day, season. For each airport (and there are 2902 of them, I’ve counted) I will synthesise ground level and upper level climate data.
What I’m starting off doing is taking the airports in the following figure (plus Honolulu, 70 or so) as starting points, and getting NOAA climate data (dew point, RH and temperature) for each, averaged over the last 20 years.
Then interpolate to all the other (2902) airports, taking into account changes in altitude and latitude.
Does that seem sensible? There are a few problems.
1) Would give wildly wrong results for the Sahara, Fiji and similar, but few aircraft land there.
2) Even with so few airports, it’s a fair bit of work, I was pulling my hair out over Santiago’s airport, having unsuccessfully tried “Santiago, Comodoro Arturo, Pudahuel, Nuevo Pudahuel, Santiago International and Santiago Peak (wrong continent)” before finding the correct “Arturo Merino Benítez”.
3) Data from NOAA arrives in a separate file for each location for each type of data, about 210 files. More, it has to be ordered in small chunks in advance and each file may take days or perhaps weeks to arrive on the web.
Date: 18/06/2016 00:05:37
From: wookiemeister
ID: 909418
Subject: re: Global climate question
I’d expect most modern aircraft would record moisture / temperatures/ flight plan
you could do better to try and get actual temperatures from airliners and flight paths rather than create a purely theoretical construct
the other thing could be that particular flight paths have more corrosion than others and it could be seasonal
I’d bet my boots the airlines already have all this data collected somewhere from their flights because it would allow them to identify efficiencies
Date: 18/06/2016 10:37:03
From: mollwollfumble
ID: 909482
Subject: re: Global climate question
wookiemeister said:
I’d expect most modern aircraft would record moisture / temperatures/ flight plan
you could do better to try and get actual temperatures from airliners and flight paths rather than create a purely theoretical construct
the other thing could be that particular flight paths have more corrosion than others and it could be seasonal
I’d bet my boots the airlines already have all this data collected somewhere from their flights because it would allow them to identify efficiencies
Ah, I’d love to see this data.
Corrosion depends on a very large number of things. The challenge is in deciding which of this myriad of things is important. For example, corrosion in the Philippines is small despite high humidity and temperature, because the mean wind speeds over the ocean there are small so the electrolyte concentration in the air is small.
On global climate, you may or may not be interested to learn that the worst part of the world for accurate climate data is South America, and the best is India.
It’s annoying when I get results like “insufficient data for climate summary” from Houston, Rio, Bogata, Sao Paulo, Stockholm and Berlin.
Date: 19/06/2016 11:20:09
From: mollwollfumble
ID: 909939
Subject: re: Global climate question
mollwollfumble said:
Data from NOAA arrives in a separate file for each location for each type of data, about 210 files. More, it has to be ordered in small chunks in advance and each file may take days or perhaps weeks to arrive on the web.
They’ve actually been quite good about it, working on weekends for me, I receive 5 or so of these files each 3 hours. And for about half there has been no time lag between ordering and arrival.
mollwollfumble said:
It’s annoying when I get results like “insufficient data for climate summary” from Houston, Rio, Bogata, Sao Paulo, Stockholm and Berlin.
And from Kinshasa and Seoul.
The following chart is of the 2902 airports around the world with both specified latitude/longitude and 3 letter IATA code (eg. LAX for Los Angeles). That should be enough points to specify global climate. You think?

Date: 19/06/2016 12:08:59
From: poikilotherm
ID: 909945
Subject: re: Global climate question
mollwollfumble said:
The following chart is of the 2902 airports around the world with both specified latitude/longitude and 3 letter IATA code (eg. LAX for Los Angeles). That should be enough points to specify global climate. You think?
Not really, it focuses on populated areas only.
Date: 20/06/2016 05:44:33
From: mollwollfumble
ID: 910208
Subject: re: Global climate question
poikilotherm said:
mollwollfumble said:
The following chart is of the 2902 airports around the world with both specified latitude/longitude and 3 letter IATA code (eg. LAX for Los Angeles). That should be enough points to specify global climate. You think?
Not really, it focuses on populated areas only.
Thanks. :-)
The NOAA have been great. I have nearly every one of those 210 or so files now. I had to re-order 8 cities when the data coming back had too many blanks. Had a jaw dropping moment when I realised that they had processed all the North American city temperatures and forgotten to tell me.
Next step is filling in gaps in data, sorting, expanding to 2902 airports using changes with latitude and altitude AND figuring out how to use all this climate data.
Date: 25/06/2016 05:27:39
From: mollwollfumble
ID: 913175
Subject: re: Global climate question
Australia’s climate is wrong!
Explanation:
I’ve now downloaded climate data from 80 met stations at major city airports around the world. Dewpoint, humidity and temperature.
The dewpoint measurements are clearly wrong for the ALL following cities. It’s given as 24+-1 degree at all times of the day and all months of the year. If true, it would leave all these cities shrouded in fog at all times of the day all winter.
Christchurch
Wellington
Auckland
Melbourne
Buenos Aires
Sydney
Perth
Brisbane
Lima
This includes every city I’ve looked at the climate for in Australia and New Zealand, but not every city in South America. In every case, the dewpoint is reported 3-hourly rather than the 1-hourly report from nearly every other one of the 80 cities.
How can I report such a massive error? And get it fixed.
Date: 25/06/2016 05:58:23
From: mollwollfumble
ID: 913177
Subject: re: Global climate question
mollwollfumble said:
Australia’s climate is wrong!
Explanation:
I’ve now downloaded climate data from 80 met stations at major city airports around the world. Dewpoint, humidity and temperature.
The dewpoint measurements are clearly wrong for the ALL following cities. It’s given as 24+-1 degree at all times of the day and all months of the year. If true, it would leave all these cities shrouded in fog at all times of the day all winter.
Christchurch
Wellington
Auckland
Melbourne
Buenos Aires
Sydney
Perth
Brisbane
Lima
This includes every city I’ve looked at the climate for in Australia and New Zealand, but not every city in South America. In every case, the dewpoint is reported 3-hourly rather than the 1-hourly report from nearly every other one of the 80 cities.
How can I report such a massive error? And get it fixed.
I sent this message to the
BOM:
Ive downloaded global climate data summaries from http://www7.ncdc.noaa.gov/CDO/dataproduct.
All the dew point data that I downloaded for Australia and New Zealand from NOAA are completely wrong. The dew point temperatures in the data are all far too high, all within a degree of 24 Celsius at all times of the day for all months of the year. This includes all data from international airports at Christchurch, Wellington, Auckland, Melbourne, Sydney, Perth, Brisbane. NOAA met station numbers 94610099999, 94767099999, 94866099999, 93119099999, 93436099999, 93780099999, 94578099999.
Please check whether the fault is in the BOM instrumentation, in the data sent by the BOM to the NCDC/NOAA, or in the processing by the NCDC/NOAA. Please arrange for the fault to be corrected.
As a side note, dew point climate data from all these cities is only available from NOAA 3-hourly, as opposed to 1-hourly from almost every other international airport in the world.
Date: 25/06/2016 16:19:51
From: PermeateFree
ID: 913392
Subject: re: Global climate question
mollwollfumble said:
mollwollfumble said:
Australia’s climate is wrong!
Explanation:
I’ve now downloaded climate data from 80 met stations at major city airports around the world. Dewpoint, humidity and temperature.
The dewpoint measurements are clearly wrong for the ALL following cities. It’s given as 24+-1 degree at all times of the day and all months of the year. If true, it would leave all these cities shrouded in fog at all times of the day all winter.
Christchurch
Wellington
Auckland
Melbourne
Buenos Aires
Sydney
Perth
Brisbane
Lima
This includes every city I’ve looked at the climate for in Australia and New Zealand, but not every city in South America. In every case, the dewpoint is reported 3-hourly rather than the 1-hourly report from nearly every other one of the 80 cities.
How can I report such a massive error? And get it fixed.
I sent this message to the BOM:
Ive downloaded global climate data summaries from http://www7.ncdc.noaa.gov/CDO/dataproduct.
All the dew point data that I downloaded for Australia and New Zealand from NOAA are completely wrong. The dew point temperatures in the data are all far too high, all within a degree of 24 Celsius at all times of the day for all months of the year. This includes all data from international airports at Christchurch, Wellington, Auckland, Melbourne, Sydney, Perth, Brisbane. NOAA met station numbers 94610099999, 94767099999, 94866099999, 93119099999, 93436099999, 93780099999, 94578099999.
Please check whether the fault is in the BOM instrumentation, in the data sent by the BOM to the NCDC/NOAA, or in the processing by the NCDC/NOAA. Please arrange for the fault to be corrected.
As a side note, dew point climate data from all these cities is only available from NOAA 3-hourly, as opposed to 1-hourly from almost every other international airport in the world.
I am sure they will be very pleased to receive your report, as they probably don’t get much public interaction.
Date: 26/06/2016 11:12:25
From: mollwollfumble
ID: 913631
Subject: re: Global climate question
I’ve got most of the way through my analysis of the world’s climate now. Results are so weird that, well, you’ll see.
For dewpoint, there are 9 faulty met stations in the southern hemisphere, and 1 in the north. With only 5 good met stations in the southern hemisphere left in my database there isn’t enough data to draw valid conclusions about dewpoint.
For temperatures, the mean temperatures vary parabolically with latitude, deviating from the parabola at latitudes above 60 degrees. The peak temperature moves north and south with the seasons. Nothing unexpected there.
The first unexpected result is the variation of mean temperatures with altitude. The results don’t match the international standard atmosphere, not even nearly. In the standard atmosphere the mean temperature falls by 6.5 degrees C with every kilometer of altitude. In the real world, the mean ground temperature falls by 4.2 degrees C with every kilometer of altitude.
The second unexpected result is the standard deviation of temperature. It isn’t proportional to the mean temperature, doesn’t have a parabolic shape, and doesn’t have a minimum that moves north and south with the seasons! Instead, it varies linearly with distance from the equator. Weird.
The third unexpected result is even weirder. First a caveat, I don’t have the variation of relative humidity with season, just the yearly probability distribution of humidity for each location, and variation with time of day. What is weird? The relative humidity doesn’t vary with either latitude or altitude. I expected higher RH near the tropics – it isn’t. I expected lower RH in the mountains, away from the coast, but it isn’t. There are local variations from place to place, but no systematic variations. This result is so weird I’m going to have to check it in greater detail by smoothing out local variations to see if I can pick up SOME sort of trend.
Date: 26/06/2016 11:17:23
From: Peak Warming Man
ID: 913632
Subject: re: Global climate question
For lunch I’m thinking fresh French bread toasted under the gorilla with melted cheese then topped with ham and washed down with a mug of piping hot black tea.
Date: 26/06/2016 11:17:55
From: Peak Warming Man
ID: 913634
Subject: re: Global climate question
Date: 26/06/2016 11:19:01
From: The Rev Dodgson
ID: 913635
Subject: re: Global climate question
Peak Warming Man said:
For lunch I’m thinking fresh French bread toasted under the gorilla with melted cheese then topped with ham and washed down with a mug of piping hot black tea.
I know some people think that local action is the answer to global climate change, but that getting ridiculous.
Date: 26/06/2016 11:47:38
From: The Rev Dodgson
ID: 913639
Subject: re: Global climate question
You’ve probably seen the site linked below, but if not, you might find it worth a visit:
Weatherzone
Date: 26/06/2016 13:09:29
From: Bubblecar
ID: 913659
Subject: re: Global climate question
Well Adam & son tried to catch the chooks but it’s pretty much impossible in daytime. There’ll be coming around at dusk for another attempt.
Date: 26/06/2016 13:10:11
From: Bubblecar
ID: 913661
Subject: re: Global climate question
Peak Warming Man said:
Woops.
+1
Date: 26/06/2016 13:28:04
From: The Rev Dodgson
ID: 913664
Subject: re: Global climate question
Bubblecar said:
Well Adam & son tried to catch the chooks but it’s pretty much impossible in daytime. There’ll be coming around at dusk for another attempt.
Your solution to climate change by local action is very nearly as futile as PWM’s.
Date: 26/06/2016 13:38:32
From: ChrispenEvan
ID: 913665
Subject: re: Global climate question
Date: 26/06/2016 13:42:36
From: stumpy_seahorse
ID: 913667
Subject: re: Global climate question
ChrispenEvan said:
am i back in chat?
LTJTB…
Date: 26/06/2016 14:25:43
From: mollwollfumble
ID: 913683
Subject: re: Global climate question
mollwollfumble said:
For dewpoint, there are 9 faulty met stations in the southern hemisphere, and 1 in the north. With only 5 good met stations in the southern hemisphere left in my database there isn’t enough data to draw valid conclusions about dewpoint.
…
Now spotted 12 faulty Met stations
email to ncei at noaa.
I’m doing a project involving corrosion of aircraft so have been looking at Dew Point records from major airports around the world. Using “Global Climate Station Summaries” over 20 years from http://www7.ncdc.noaa.gov/CDO/dataproduct
The first thing I noticed was a marked asymmetry in dew point between southern and northern hemispheres. Tracking down the problem I found that 12 of the Met stations I was looking at had the exact same dew point data. There must be a major fault in your climate generation program that produces the same dew point data for a large number of different Met stations.
The duplicates I found are for these Met stations, all of which give the exact same dew point data, even exact to the number of observations for each hour of the day and month of the year.
84071099999 Mariscal Sucre
91182022521 Honolulu
84628099999 Jorge Chavez
85574099999 Arturo Merino
87585099999 Buenos Aires
93119099999 Auckland
93436099999 Wellington
93780099999 Christchurch
94610099999 Perth
94767099999 Sydney
94866099999 Melbourne
94578099999 Brisbane
As dew points for all those Met stations are wrong, it seems likely that dew points are wrong for a large number of other Met stations.
The duplicated data has first line
mean 23 23 23.4 23.5 24.3 24.3 24.2 24.4 24.6 24.9 24.5 23.7 24
These dew point temperatures are too large except near the equator, and are clearly wrong for all of the above stations. The duplicated data has last line
#obs 2225 2007 2287 2466 2595 2148 2526 2480 2374 2366 2318 2210 28002
The Rev Dodgson said:
You’ve probably seen the site linked below, but if not, you might find it worth a visit:
Weatherzone
“It turns out that absolute humidity relates much better to human comfort and safety than Relative Humidity does. At sea level, Dew Point is a good index of absolute humidity. People tend to find Dew Points exceeding 17 degrees intolerable.”
Ta. I hadn’t seen that. Here’s a plot of sea level RH as a function of latitude.

As I said, no obvious correlation. The low point is Kuwait, pretty clearly influenced by the nearby Sahara.
It turns out that there is a correlation between RH and altitude, but only between the hours of 9am to 9pm, not between 9pm and 9am.
Date: 26/06/2016 15:23:29
From: PermeateFree
ID: 913703
Subject: re: Global climate question
mollwollfumble said:
mollwollfumble said:
For dewpoint, there are 9 faulty met stations in the southern hemisphere, and 1 in the north. With only 5 good met stations in the southern hemisphere left in my database there isn’t enough data to draw valid conclusions about dewpoint.
…
Now spotted 12 faulty Met stations
email to ncei at noaa.
I’m doing a project involving corrosion of aircraft so have been looking at Dew Point records from major airports around the world. Using “Global Climate Station Summaries” over 20 years from http://www7.ncdc.noaa.gov/CDO/dataproduct
The first thing I noticed was a marked asymmetry in dew point between southern and northern hemispheres. Tracking down the problem I found that 12 of the Met stations I was looking at had the exact same dew point data. There must be a major fault in your climate generation program that produces the same dew point data for a large number of different Met stations.
The duplicates I found are for these Met stations, all of which give the exact same dew point data, even exact to the number of observations for each hour of the day and month of the year.
84071099999 Mariscal Sucre
91182022521 Honolulu
84628099999 Jorge Chavez
85574099999 Arturo Merino
87585099999 Buenos Aires
93119099999 Auckland
93436099999 Wellington
93780099999 Christchurch
94610099999 Perth
94767099999 Sydney
94866099999 Melbourne
94578099999 Brisbane
As dew points for all those Met stations are wrong, it seems likely that dew points are wrong for a large number of other Met stations.
The duplicated data has first line
mean 23 23 23.4 23.5 24.3 24.3 24.2 24.4 24.6 24.9 24.5 23.7 24
These dew point temperatures are too large except near the equator, and are clearly wrong for all of the above stations. The duplicated data has last line
#obs 2225 2007 2287 2466 2595 2148 2526 2480 2374 2366 2318 2210 28002
The Rev Dodgson said:
You’ve probably seen the site linked below, but if not, you might find it worth a visit:
Weatherzone
“It turns out that absolute humidity relates much better to human comfort and safety than Relative Humidity does. At sea level, Dew Point is a good index of absolute humidity. People tend to find Dew Points exceeding 17 degrees intolerable.”
Ta. I hadn’t seen that. Here’s a plot of sea level RH as a function of latitude.
As I said, no obvious correlation. The low point is Kuwait, pretty clearly influenced by the nearby Sahara.
It turns out that there is a correlation between RH and altitude, but only between the hours of 9am to 9pm, not between 9pm and 9am.
Been chatting with the Observer?