Date: 4/01/2017 02:38:27
From: mollwollfumble
ID: 1005354
Subject: Which sea level?

When a mountain height is specified as “height above sea level”, which sea level?
For example Mt Everest, how do they determine what the sea level would be at that location if the mountain wasn’t there?

There is such a thing as the “WGS84 ellipsoid” and the “OSU91A geoid”. “While the WGS84 ellipsoid is based on an approximation of the Earth’s shape using only an equatorial radius and a polar radius, the OSU91A geoid is a more complex surface representing mean sea level.” There can be up to 67 metre difference between the two “sea levels”.

There are satellite gravity measurements by GOCE giving shapes of the Earth like this:

In addition, there are prevailing winds and ocean currents that change the sea level in a systematic way across the globe that need to be added on top of the GOCE shape of the Earth. How are these continued across continents for example under My Everest?

And are the heights of mountains continually being updated as more accurate representations of sea level are developed? eg. changed by 67 metres or so.

Reply Quote

Date: 4/01/2017 02:48:38
From: Tau.Neutrino
ID: 1005356
Subject: re: Which sea level?

Have you read this?

https://en.wikipedia.org/wiki/Sea_level

I dont know if it answers your question

Reply Quote

Date: 4/01/2017 02:52:02
From: Tau.Neutrino
ID: 1005357
Subject: re: Which sea level?

https://www.environment.gov.au/climate-change/climate-science/climate-change-future/sea-level

this article discusses thermal expansion and ice melt

Reply Quote

Date: 4/01/2017 03:03:00
From: Tau.Neutrino
ID: 1005362
Subject: re: Which sea level?

this article talks about the official North American Vertical Datum.

http://theconversation.com/explainer-how-do-you-measure-a-seas-level-anyway-41420

In order to bring some order to all of these geographical variations, and to provide a constant point of reference, a datum or base level was established based on averaging out the elevation of sea level from many tide gauges over an extended period of time. This datum is now called the North American Vertical Datum (or NAVD) and is the elevation (close to mean sea level) on which all map elevations are based. So if a wharf, highway or building is “20 feet above sea level,” it is 20 feet above this official North American Vertical Datum.

Reply Quote

Date: 4/01/2017 03:12:48
From: The Rev Dodgson
ID: 1005363
Subject: re: Which sea level?

My first reaction was “surely mollwoll should know the answer to this question”, followed fairly rapidly by “I don’t think I know the answer to this question”.

Even if we accept that we can fix sea level at the coasts from tide gauge readings, interpolating for any point inland must be subject to fairly large errors.

I presume that current procedures are a continuation of methods used in 19th and early 20th century, but how these could be accurate to even a few metres, I don’t know.

Reply Quote

Date: 4/01/2017 03:14:10
From: Tamb
ID: 1005364
Subject: re: Which sea level?

The Rev Dodgson said:


My first reaction was “surely mollwoll should know the answer to this question”, followed fairly rapidly by “I don’t think I know the answer to this question”.

Even if we accept that we can fix sea level at the coasts from tide gauge readings, interpolating for any point inland must be subject to fairly large errors.

I presume that current procedures are a continuation of methods used in 19th and early 20th century, but how these could be accurate to even a few metres, I don’t know.


Maybe we should measure from the centre of the Earth.

Reply Quote

Date: 4/01/2017 04:33:00
From: Tau.Neutrino
ID: 1005380
Subject: re: Which sea level?

Tau.Neutrino said:


this article talks about the official North American Vertical Datum.

http://theconversation.com/explainer-how-do-you-measure-a-seas-level-anyway-41420

In order to bring some order to all of these geographical variations, and to provide a constant point of reference, a datum or base level was established based on averaging out the elevation of sea level from many tide gauges over an extended period of time. This datum is now called the North American Vertical Datum (or NAVD) and is the elevation (close to mean sea level) on which all map elevations are based. So if a wharf, highway or building is “20 feet above sea level,” it is 20 feet above this official North American Vertical Datum.

a few more related articles

Geodetic datum
https://en.wikipedia.org/wiki/Geodetic_datum#Vertical_datum

North American Vertical Datum of 1988
https://en.wikipedia.org/wiki/North_American_Vertical_Datum_of_1988

Metres above sea level
https://en.wikipedia.org/wiki/Metres_above_sea_level

Standard sea level
https://en.wikipedia.org/wiki/Standard_sea_level

Explainer: how do you measure a sea’s level, anyway?
http://theconversation.com/explainer-how-do-you-measure-a-seas-level-anyway-41420

What does the science really say about sea-level rise?
http://theconversation.com/what-does-the-science-really-say-about-sea-level-rise-56807

http://www.cmar.csiro.au/sealevel/
https://www.environment.gov.au/climate-change/climate-science/climate-change-future/sea-level

How do we define sea level and what place is taken as a reference?
https://www.quora.com/How-do-we-define-sea-level-and-what-place-is-taken-as-a-reference

Reply Quote

Date: 4/01/2017 04:34:30
From: transition
ID: 1005381
Subject: re: Which sea level?

reliable really, what gravity does with a liquid mass, guys that built the pyramids relied on it.

Reply Quote

Date: 4/01/2017 07:17:17
From: Witty Rejoinder
ID: 1005420
Subject: re: Which sea level?

Tamb said:

Maybe we should measure from the centre of the Earth.

IIRC if that were the case Everest would no longer be number one.

Reply Quote

Date: 4/01/2017 07:22:07
From: Witty Rejoinder
ID: 1005421
Subject: re: Which sea level?

https://en.m.wikipedia.org/wiki/Chimborazo

Reply Quote

Date: 4/01/2017 07:23:00
From: Tamb
ID: 1005422
Subject: re: Which sea level?

Witty Rejoinder said:


Tamb said:

Maybe we should measure from the centre of the Earth.

IIRC if that were the case Everest would no longer be number one.


Mount Kilimanjaro perhaps.

Reply Quote

Date: 4/01/2017 07:27:42
From: Witty Rejoinder
ID: 1005423
Subject: re: Which sea level?

https://en.m.wikipedia.org/wiki/Summits_farthest_from_the_Earth’s_center

Reply Quote

Date: 4/01/2017 07:34:25
From: poikilotherm
ID: 1005424
Subject: re: Which sea level?

Tamb said:


Witty Rejoinder said:

Tamb said:

Maybe we should measure from the centre of the Earth.

IIRC if that were the case Everest would no longer be number one.


Mount Kilimanjaro perhaps.

Mauna Kea or some such in HAwaii I think

Reply Quote

Date: 4/01/2017 07:38:17
From: Witty Rejoinder
ID: 1005425
Subject: re: Which sea level?

poikilotherm said:

Mauna Kea or some such in HAwaii I think

Mauna Kea is over 10km from its base to its summit which is a record.

Reply Quote

Date: 4/01/2017 07:39:21
From: Cymek
ID: 1005426
Subject: re: Which sea level?

On other planets that lack a liquid ocean, planetologists can calculate a “mean altitude” by averaging the heights of all points on the surface. This altitude, sometimes referred to as a “sea level”, serves equivalently as a reference for the height of planetary features

Reply Quote

Date: 4/01/2017 07:59:46
From: Tamb
ID: 1005429
Subject: re: Which sea level?

Witty Rejoinder said:


https://en.m.wikipedia.org/wiki/Summits_farthest_from_the_Earth’s_center

So my guess at Kilimanjaro was pretty close. Off by 172 metres.

Reply Quote

Date: 4/01/2017 13:31:54
From: mollwollfumble
ID: 1005549
Subject: re: Which sea level?

> These geographic variations were resolved in 1993 when two satellites were launched that use radar to measure the level of the ocean very precisely from space. This high-tech approach eliminates the problems of land motion on Earth and has given us a new global sea-level rise rate over the past 22 years of 3.2 millimeters per year, the equivalent of 12 inches per century.

As I mentioned above. These GOCE results need to be modified to take account of ocean currents and wind speeds.

> Vertical datums are either: tidal, based on sea levels; gravimetric, based on a geoid; or geodetic, based on the same ellipsoid models of the Earth used for computing horizontal datums. For the purpose of measuring the height of objects on land, the usual datum used is mean sea level (MSL). This is a tidal datum which is described as the arithmetic mean of the hourly water elevation taken over a specific 19 years cycle. This will not remove the effects of local gravity strength, and so the height of MSL, relative to a geodetic datum, will vary around the world, and even around one country. Countries tend to choose the mean sea level at one specific point to be used as the standard “sea level” for all mapping and surveying in that country. Zero elevation as defined by one country is not the same as zero elevation defined by another.

That doesn’t explain either which standard point MSL is used for measuring Mt Everest and Antarctica. And it doesn’t explain how that point is extrapolated across the country.

> NAVD

I hope they’re not using mean sea level in North America for measuring Mt Everest or Antarctica.

> The UK’s Mean Sea Level is based on 1915 to 1921 at a specific coastal location in Cornwall.

Well, that’s not very useful.

> GPS base height measurements on an ellipsoid of the entire Earth.

As I said above, that can be out by 67 metres if not more. PS, I wondering several years ago why GPS measurements of coastal points in northern Australia were giving negative results.

> TOPEX/Poseidon in 1992, Jason in 2001, Jason 2 in 2008.

Yes, but are they used or are we still using measurements from 100 years ago?

> WGS84 an ellipsoid from 1984. Can be out by 100 metres.

Yes, I mentioned that. 100 > 67 tick.

> geoid-based vertical datum such as NAVD88

Has been superseded, except possibly in North America.

In summary, the links provided by Tau.Neutrino mainly complicate matters. They don’t really resolve what is currently used for Everest or Antarctica. They don’t clarify whether what is used is based on a single point calculated 100 years ago or whether what is used is based on the latest satellite data from 2008, or something in between.

But they do clarify heights to the extent that is is not totally wrong to specify mountain heights above sea level by extrapolating from the current mean sea level found as locally as possible.

Two links that Tau.Neutrino didn’t post are https://en.wikipedia.org/wiki/Figure_of_the_Earth
which mentions standards
ED50 European Datum 1950
SAD69 South American Datum 1969
GRS 80 Geodetic Reference System 1980
NAD83 North American Datum 1983
WGS84 World Geodetic System 1984
NAVD88 N. American Vertical Datum 1988
ETRS89 European Terrestrial Reference System 1989
GCJ-02 Chinese encrypted datum 2002
International Terrestrial Reference System
Spatial Reference System Identifier (SRID)
Universal Transverse Mercator (UTM)

Doesn’t mention OSU91A

“OSU91 is a global geopotential model produced by the Ohio State University (OSU).”

Semi-major axis 6378136.3 metres
Inverse flattening 298.257223563
Do I take that to mean that the polar axis is 6378136.3 * (1-1/298.257223563) ?
If so, then I can use that in converting (x,y) to latitude and longitude.

Original source for OSU91A is https://ntrs.nasa.gov/archive/nasa/casi.ntrs.nasa.gov/19920004288.pdf
According to Table 14 the sea surface topography is a full geoid model, with 55 Fourier coefficients, I certainly don’t want to program that in Excel.
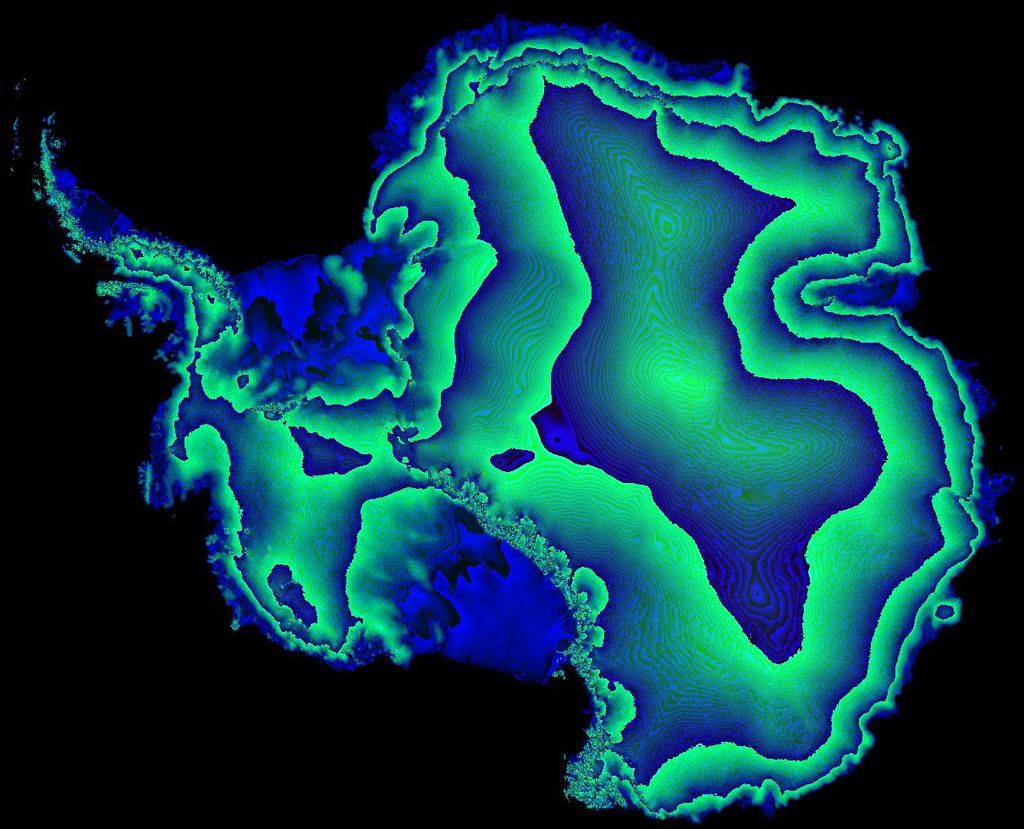
According to Table 16, that’s 120 Fourier coefficients. Hmm, BIG difference between geoid and ellipsoid for both. And big difference over Antarctica eg. 90 metres difference using Table 14 and 160 metres difference using Table 16.

Here we go, starting explanation of OSU91A at Table 22. Oh yuk, that’s more complicated, with a switch over from one system to another at specific angle.

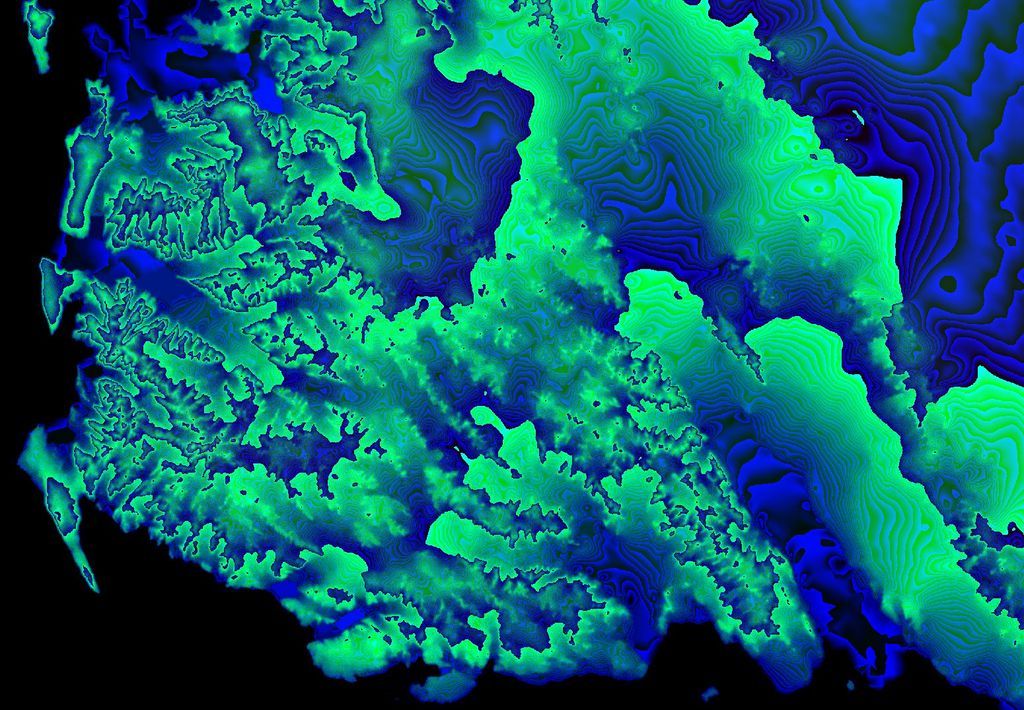
A more recent one for Antarctica, more recent than OSU91 is EGM96. The difference between the two is typically 0.5 metres over the whole of the Antarctic continent, rising to 4+ metres in a small part of Norway’s territory.

Reply Quote

Date: 4/01/2017 13:36:05
From: mollwollfumble
ID: 1005551
Subject: re: Which sea level?

Calling for help from a university department that specialises in surveying and geodesy.

Reply Quote

Date: 4/01/2017 14:07:57
From: Tau.Neutrino
ID: 1005564
Subject: re: Which sea level?

mollwollfumble said:


Calling for help from a university department that specialises in surveying and geodesy.

I get the impression things need tidying up.

Reply Quote

Date: 4/01/2017 14:17:53
From: Tau.Neutrino
ID: 1005569
Subject: re: Which sea level?

Tau.Neutrino said:


mollwollfumble said:

Calling for help from a university department that specialises in surveying and geodesy.

I get the impression things need tidying up.

Are they worried over rogue countries using accurate information for missiles?

Reply Quote

Date: 4/01/2017 22:10:15
From: mollwollfumble
ID: 1005626
Subject: re: Which sea level?

Tau.Neutrino said:


Tau.Neutrino said:

mollwollfumble said:

Calling for help from a university department that specialises in surveying and geodesy.

I get the impression things need tidying up.

Are they worried over rogue countries using accurate information for missiles?

Actually, yes.

The whole “figure of the earth” thing was initially developed to provide accurate surface coordinates for missiles. It’s no use sending a missile to a specific latitude and longitude unless you also know the altitude.

And the the official Japanese database is encrypted.

Slightly off topic. Someone commented on chat that the coastline of Antarctica looked like a fractal. It’s true. Here is the default colour map for a tiff containing radar heights of Antarctica.

And here’s a detail of the New Zealand Antarctic Territory coastline.

Reply Quote

Date: 5/01/2017 07:23:15
From: mollwollfumble
ID: 1005723
Subject: re: Which sea level?

Tau.Neutrino said:


mollwollfumble said:

Calling for help from a university department that specialises in surveying and geodesy.

I get the impression things need tidying up.

(Laughs insanely to self). I’ve just found out by how much things need tidying up. The website
http://icgem.gfz-potsdam.de/ICGEM/
gives details of 158 different “mean sea level” models!

Including for example six different mean sea level models published in the year 2016.

Luckily, there’s a calculator to compare them, which I’m about to dip into now.

Reply Quote

Date: 5/01/2017 11:28:19
From: mollwollfumble
ID: 1005857
Subject: re: Which sea level?

mollwollfumble said:


Tau.Neutrino said:

mollwollfumble said:

Calling for help from a university department that specialises in surveying and geodesy.

I get the impression things need tidying up.

(Laughs insanely to self). I’ve just found out by how much things need tidying up. The website
http://icgem.gfz-potsdam.de/ICGEM/
gives details of 158 different “mean sea level” models!

Including for example six different mean sea level models published in the year 2016.

Luckily, there’s a calculator to compare them, which I’m about to dip into now.

Mean sea level for mathematical models from the last 15 years don’t vary all that much.
Over the whole of Antarctica, the one from 1991 differs from a more recent one by an average of 1.5 metres, maximum 12 metres, 2.5 metres at the south pole.

More of a problem is a mismatch between calculated latitude longitude locations and peaks shown on Google Earth imagery. Errors in horizontal position seem to be of the rough order of 800 m, which is much larger than my 200 m grid resolution, and is large enough to make it quite difficult to identify which peak is actually the high one. I can only hope that there is a systematic error in Google Earth that I can adjust for.

Perhaps if I try to get Excel to write me a file in .kml format?

Reply Quote

Date: 5/01/2017 22:24:10
From: mollwollfumble
ID: 1005940
Subject: re: Which sea level?

mollwollfumble said:


More of a problem is a mismatch between calculated latitude longitude locations and peaks shown on Google Earth imagery. Errors in horizontal position seem to be of the rough order of 800 m, which is much larger than my 200 m grid resolution, and is large enough to make it quite difficult to identify which peak is actually the high one. I can only hope that there is a systematic error in Google Earth that I can adjust for.

Perhaps if I try to get Excel to write me a file in .kml format?


Found I can translate from stereographic to lat,long many locations at a time using https://mygeodata.cloud/cs2cs/ with cut and paste from Excel. Stereographic is EPSG:3031, lat long is EPSG:4326.

> Perhaps if I try to get Excel to write me a file in .kml format?
Done. Can cut and paste Excel csv directly into kml.

Checking results for about 300 peaks against Google Earth. For very few of those can I be sure which Google Earth feature is actually the peak. Those I can identify have a random position error between 135 m and 1590 m, seemingly in random direction. I suspect the problem is not with Google Earth but with the radar data. The radar data was not measured my siting the radar over a specific location and clicking “save”, it was measured by taking regular times along a satellite path. And that means interpolating the result onto a 200 m grid. My guess is that the interpolation algorithm they used is not accurate to 200 m. Looks pretty at that resolution, though.

Now trying to export the 200 m grid height data into ascii xyz format. It looks to be generating a file 14.1 GB in size. This is supposed to be about a quarter the size of an equivalent csv file. First attempt crashed.

Reply Quote

Date: 6/01/2017 07:51:38
From: mollwollfumble
ID: 1006199
Subject: re: Which sea level?

mollwollfumble said:


mollwollfumble said:

More of a problem is a mismatch between calculated latitude longitude locations and peaks shown on Google Earth imagery. Errors in horizontal position seem to be of the rough order of 800 m, which is much larger than my 200 m grid resolution, and is large enough to make it quite difficult to identify which peak is actually the high one. I can only hope that there is a systematic error in Google Earth that I can adjust for.

Perhaps if I try to get Excel to write me a file in .kml format?


Found I can translate from stereographic to lat,long many locations at a time using https://mygeodata.cloud/cs2cs/ with cut and paste from Excel. Stereographic is EPSG:3031, lat long is EPSG:4326.

> Perhaps if I try to get Excel to write me a file in .kml format?
Done. Can cut and paste Excel csv directly into kml.

Checking results for about 300 peaks against Google Earth. For very few of those can I be sure which Google Earth feature is actually the peak. Those I can identify have a random position error between 135 m and 1590 m, seemingly in random direction. I suspect the problem is not with Google Earth but with the radar data. The radar data was not measured my siting the radar over a specific location and clicking “save”, it was measured by taking regular times along a satellite path. And that means interpolating the result onto a 200 m grid. My guess is that the interpolation algorithm they used is not accurate to 200 m. Looks pretty at that resolution, though.

Now trying to export the 200 m grid height data into ascii xyz format. It looks to be generating a file 14.1 GB in size. This is supposed to be about a quarter the size of an equivalent csv file. First attempt crashed.

Disaster. At least one height in the 200 m grid data is confirmed out by more than 130 metres, other points look even further out. That means I can’t trust any of it!

Mean sea level errors at the same location can’t exceed 14 metres in height.

Reply Quote

Date: 8/01/2017 03:26:45
From: mollwollfumble
ID: 1006910
Subject: re: Which sea level?

mollwollfumble said:


Disaster. At least one height in the 200 m grid data is confirmed out by more than 130 metres, other points look even further out. That means I can’t trust any of it!

Mean sea level errors at the same location can’t exceed 14 metres in height.

Sturgeon’s Law “Ninety percent of everything is crap”.
mollwollfumble’s corollary “Sturgeon was an optimist”.

So far I’ve proved peak height errors for Antarctic mountains exceeding 200 metres and horizontal errors exceeding 1 km for all of the following sources:

Google Earth
Australian Gazetteer
US Gazetteer
French Gazetteer
Peakbagger
Wikipedia
Old USGS topographic maps
RAMP satellite radar data

Now trying ASTER digital elevation model (DEM). Slight problem in that over Antarctica, the ASTER dataset is not one DEM but >40,000 DEMs. And even downloading 484 of those has taken 20 minutes to be 0% complete.

Give up?

Reply Quote

Date: 8/01/2017 03:31:34
From: The Rev Dodgson
ID: 1006917
Subject: re: Which sea level?

mollwollfumble said:

So far I’ve proved peak height errors for Antarctic mountains exceeding 200 metres and horizontal errors exceeding 1 km for all of the following sources:

Google Earth
Australian Gazetteer
US Gazetteer
French Gazetteer
Peakbagger
Wikipedia
Old USGS topographic maps
RAMP satellite radar data

Is 90% of Sturgeon’s Law crap?

Surely it’s possible that one of the sources on your list is accurate?

Reply Quote

Date: 8/01/2017 06:53:52
From: mollwollfumble
ID: 1007076
Subject: re: Which sea level?

The Rev Dodgson said:


mollwollfumble said:

So far I’ve proved peak height errors for Antarctic mountains exceeding 200 metres and horizontal errors exceeding 1 km for all of the following sources:

Google Earth
Australian Gazetteer
US Gazetteer
French Gazetteer
Peakbagger
Wikipedia
Old USGS topographic maps
RAMP satellite radar data

Is 90% of Sturgeon’s Law crap?

Surely it’s possible that one of the sources on your list is accurate?

Unfortunately not.

The mountain range that contains Australia’s highest (rock) mountain is completely missing from Google Earth’s topography file.
The Australian Gazetteer is provably out by close to 570 metres for the height of Mount Bewsher.
The US Gazetter has three different heights for Mount Vinson, two differing by 280 metres from each other.
The French Gazetteer gives the height of 39,708 metres for Mont du Sabat, where the real height is actually 31 metres.
Peakbagger mistook 158 degrees West longitude for 158 degrees East longitude.
Wikipedia – copied the above error from Peakbagger.
An old USGS topographic map made an error of 470 metres in height, and separately 2400 metres horizontally, for mountains in the Sentinel Range.
RAMP satellite radar data is out by 690 metres for the height of Mount Mohl, and is out roughly 2900 metres horizontally for Mount Jumper.

I’ve gone a bit further than that – the average error in RAMP satellite radar data is 210 metres in height and 1.1 km horizontally.
The average error in old USGS topographic maps is 160 metres in height and 810 metres horizontally.
In Wikipedia, the average error in horizontal position for nearly all Antarctic mountains must exceed 550 metres (it may be a lot more than that).

Damnit.

Reply Quote

Date: 8/01/2017 21:30:39
From: mollwollfumble
ID: 1007427
Subject: re: Which sea level?

> Now trying ASTER digital elevation model (DEM). Slight problem in that over Antarctica, the ASTER dataset is not one DEM but >40,000 DEMs. And even downloading 484 of those has taken 20 minutes to be 0% complete.

> Even downloading 4 of those took 20 minutes to be 0% complete.

Every time I try to access ASTER I seem to end up in a different satellite database (version 2, version 3, orthocorrected, antarctic peninsula etc.). I finally hit ASTER GDEM version 2, ‘G’ stands for Global, where the ASTER dataset in Antarctica is only 27,000 separate DEMs, and where finally the dataset isn’t time-dependent.

Unlike RAMP, ASTER doesn’t reach the South Pole and has gaps at other latitudes and longitudes.

Much finer horizontal resolution than RAMP, typically 30 m * 8.5 m instead of 200 m * 200 m. Accuracy still to be determined, eg Mt Mohl:
Topographic Map height 3604 m
Wikipedia height 3710 m
RAMP satellite radar height 3033 m
ASTER satellite radar height 3495 m.

No way of knowing yet which, if any, is correct. Whichever one is correct, all the others are out by more than 100 metres in altitude.

Reply Quote

Date: 12/01/2017 00:21:35
From: mollwollfumble
ID: 1008663
Subject: re: Which sea level?

I’ve come to a conclusion.

The whole purpose of the USA Antarctic Gazetteer is to confuse.

The Bulgarian Gazetteer is good.

But the peaks on the USA Gazetteer are just sufficiently wrong, that attempting to match any point in the Gazetteer to any real feature in Antarctica is going to result in the wrong real feature being selected about 30 to 40% of the time. Just enough to drive any person trying to match the two totally insane.

In the following map of Sentinel Range, peaks in the combined International Gazetteer are marked as the points where line direction changes. Real peaks, from ASTER, are shown as lighter colour. Allocating real peaks with any reliability to Gazetteer peaks is impossible. (PS, I’ve been trying to do this mathematically). Why bother? Simply because without the Gazetteer hardly any objects in Antarctica have names.

Reply Quote

Date: 12/01/2017 07:39:12
From: mollwollfumble
ID: 1008855
Subject: re: Which sea level?

In the following map of Sentinel Range, peaks higher than 2,200 metres are calculated directly from the ASTER GDEM2 datafile. Again, peaks are displayed as changes of line direction. I found these mathematically using a 270*270 metre template.

Note how different the real peaks are to the ones in the picture above where the results from the Gazetteer are shown.

Reply Quote

Date: 13/01/2017 14:24:35
From: mollwollfumble
ID: 1009508
Subject: re: Which sea level?

Darn, ASTER has problems, too. When she is good she is very very good, but when she is bad she is horrid.

The following plot shows the quality of data for the transantarctic mountains, not the mountains themselves. The plot is latitude degrees vs longitude degrees. Northernmost latitudes at the top. Longitude is side to side, so is at an exaggerated scale relative to latitude. Black is unusably bad quality. White is (mostly) OK quality, but not the white speckles in otherwise black areas. There’s far too much black, I’m looking at about 30% data loss The multiple black squares at mid and lower right are mostly the Ross Ice Shelf.

Also, for ASTER, which sea level? I haven’t found out yet.

Reply Quote

Date: 14/01/2017 04:30:46
From: mollwollfumble
ID: 1009701
Subject: re: Which sea level?

A more familiar view of the Transantarctic mountains. From the ASTER GDEM.

Whiter is higher. The Ross Ice Shelf is on the left. Speckled black is faulty data. NZ Territory is within 20 degrees of vertical. Australian Territory is to the right of that. The second image, to the right, is RAMP data for much the same area, with RAMP there is no faulty data, but the resolution horizontally and vertically is unacceptable.

Reply Quote

Date: 16/01/2017 04:04:15
From: mollwollfumble
ID: 1010685
Subject: re: Which sea level?

mollwollfumble said:


A more familiar view of the Transantarctic mountains. From the ASTER GDEM.

Whiter is higher. The Ross Ice Shelf is on the left. Speckled black is faulty data. NZ Territory is within 20 degrees of vertical. Australian Territory is to the right of that. The second image, to the right, is RAMP data for much the same area, with RAMP there is no faulty data, but the resolution horizontally and vertically is unacceptable.

http://i120.photobucket.com/albums/o162/DavidPaterson/SSSF/ASTER%20TAM_zpsjq9jya9k.jpg
http://i120.photobucket.com/albums/o162/DavidPaterson/SSSF/RAMP%20TAM_zpsit3oglgl.jpg

ASTER GDEM for Transantarctic Mountains. Spurious(?) peaks found by algorithm. The area is a zoom in on part of the bottom right of the two images above (latitude 72.5 degrees South). The top image below shows raw ASTER altitude data – looks like some linoleum I know. The bottom image is the same but the known bad data is coloured black and found peaks are shown as changes of line direction. Peaks are all above 2,200 metres altitude.

At least the black mask is finding and killing most of the spurious data.

Reply Quote

Date: 16/01/2017 04:35:59
From: mollwollfumble
ID: 1010734
Subject: re: Which sea level?

mollwollfumble said:


ASTER GDEM for Transantarctic Mountains. Spurious(?) peaks found by algorithm. The area is a zoom in on part of the bottom right of the two images above (latitude 72.5 degrees South). The top image below shows raw ASTER altitude data – looks like some linoleum I know. The bottom image is the same but the known bad data is coloured black and found peaks are shown as changes of line direction. Peaks are all above 2,200 metres altitude.

At least the black mask is finding and killing most of the spurious data.

http://i120.photobucket.com/albums/o162/DavidPaterson/SSSF/Spurious1_zpsnidycemz.jpg

http://i120.photobucket.com/albums/o162/DavidPaterson/SSSF/Spurious2_zpszwaokexg.jpg

Definitely spurious. The same peak locations are plotted over the RAMP radar data (contrast enhanced) below at the same resolution. Keep in mind that the RAMP radar altitudes and locations may be badly in error. The RAMP data says that there may be real peaks (ice domes) in this area, but definitely not in the locations found from the ASTER data.

Reply Quote

Date: 16/01/2017 04:52:55
From: mollwollfumble
ID: 1010739
Subject: re: Which sea level?

Although the peaks are spurious, it’s comforting that the RAMP and ASTER data agree on altitudes (between 2200 and 2300 metres) well within the error limits of RAMP altitudes.

Although I don’t know for sure why ASTER has so much spurious data, I suspect that it may be because ASTER is using binocular vision to detect altitudes. Binocular vision method would be startlingly inaccurate for a uniformly lit area such as a snow field, especially during a blizzard. But I don’t know, ASTER could be using the more accurate LIDAR for all I know.

Reply Quote

Date: 17/01/2017 05:16:23
From: mollwollfumble
ID: 1011092
Subject: re: Which sea level?

What does Prince Charles have to do with the three musketeers? The Prince Charles Mountains in the Australian Antarctic Territory consists of three ranges names Athos, Porthos and Aramis after the three musketeers. These mountains are the cloud-like shapes in the following ASTER GDEM 2 topographic map. Black is bad data and sea level. Smooth grey is snow and ice fields.

Reply Quote

Date: 20/01/2017 03:34:22
From: mollwollfumble
ID: 1012450
Subject: re: Which sea level?

Changed peak finding algorithm to greatly reduce the incidence of spurious peaks.
Before, I had automatic algorithm set to defining “peak” as a drop of 5 or more metres over ~135 metres.
Now, “peak” is defined as a drop of 15 or more metres over ~1.1 km.

Much Better, but still have some spurious peaks. The following shows (I count 24) spurious peaks on the Ross Ice Shelf.

Reply Quote

Date: 20/01/2017 03:52:04
From: mollwollfumble
ID: 1012473
Subject: re: Which sea level?

Same image but with RAMP Radar data. It does look remarkably similar, doesn’t it. But this time it’s easier to count the spurious peaks.

Reply Quote

Date: 20/01/2017 03:53:17
From: The Rev Dodgson
ID: 1012474
Subject: re: Which sea level?

How do you know when a peak is spurious?

Reply Quote

Date: 20/01/2017 04:23:53
From: mollwollfumble
ID: 1012493
Subject: re: Which sea level?

The Rev Dodgson said:


How do you know when a peak is spurious?

In the above case, when the peak height in the RAMP data is that of sea level, it’s a good indicator that the peak is spurious.

But more generally, I remove as much as possible from the ASTER data by using three guides. Guide 1 is if more than 1/3 of the nearby locations have been observed by the satellite 2 or fewer times, because three times are definitely needed for anything reliable. Guide 2 is by how much the putative peak rises above adjacent terrain. For guides 1 & 2 I use what I call “prominence, peakiness and quality”

Guide 3 would have to be what does the RAMP dataset say.

Then I think the next check has to be “by eye”. Nothing beats good old eyeballing of data to spot errors. For example, a single high pixel among a sea of lower pixels will be spurious. I now know to discard odd-shaped mesas with cliff edges. But still, even by eye I could mistake for example, an iceberg for a mountain. Or an data flaw for a cliff.

The final check would have to be to try to match ASTER peaks with the International Antarctic Gazetteer. This is trouble, because mountains and peaks in the Gazetteer tend to be in the wrong locations at the wrong heights, making identification extremely difficult if not impossible in 50% of the cases.

ASTER may observe a cloud and think it’s an Antarctic mountain peak. If it sees a cloud on one observation and ground on a second observation then it may average the heights to get the wrong result. Another error is where the satellite can’t distinguish one patch of ice from another, so mismatches the binocular view.

Reply Quote

Date: 28/01/2017 07:20:08
From: mollwollfumble
ID: 1016723
Subject: re: Which sea level?

The Antarctic Peninsula, from ASTER GDEM 2 data.

Looks like an octopus tentacle. The black speckles and white speckles are bad data.

Reply Quote

Date: 3/02/2017 22:58:05
From: mollwollfumble
ID: 1020124
Subject: re: Which sea level?

mollwollfumble said:


The Antarctic Peninsula, from ASTER GDEM 2 data.

Looks like an octopus tentacle. The black speckles and white speckles are bad data.

http://i120.photobucket.com/albums/o162/DavidPaterson/SSSF/Peninsula_zpsh7jzwemk.jpg

Finally got through all the ASTER GDEM 2 data.

42630 peaks found in Antarctica, including spurious peaks.

Compare with from RAMP 200m resolution data

54227 peaks found in Antarctica

Hey, that’s a decent match! The RAMP data covers all of Antarctica, ASTER misses large chunks.

From RAMP 1 km resolution data

13811 peaks found in Antarctica.

So far so good. What next? Obviously I can’t check all peaks by eye.

Reply Quote

Date: 3/02/2017 23:00:20
From: mollwollfumble
ID: 1020125
Subject: re: Which sea level?

mollwollfumble said:


mollwollfumble said:

The Antarctic Peninsula, from ASTER GDEM 2 data.

Looks like an octopus tentacle. The black speckles and white speckles are bad data.

http://i120.photobucket.com/albums/o162/DavidPaterson/SSSF/Peninsula_zpsh7jzwemk.jpg

Finally got through all the ASTER GDEM 2 data.

42630 peaks found in Antarctica, including spurious peaks.

Compare with from RAMP 200m resolution data

54227 peaks found in Antarctica

Hey, that’s a decent match! The RAMP data covers all of Antarctica, ASTER misses large chunks.

From RAMP 1 km resolution data

13811 peaks found in Antarctica.

So far so good. What next? Obviously I can’t check all peaks by eye.

There is also the significant problem of incompatible coordinate systems – ASTER uses latitude and longitude – RAMP uses metres from the pole.

Reply Quote

Date: 5/02/2017 09:59:49
From: mollwollfumble
ID: 1020667
Subject: re: Which sea level?

btm said:


mollwollfumble said:

Excuse the whinge. Perhaps by listing what doesn’t work I can think of something that does.

I want to transform 100,000 data pairs from (longitude,latitude) to a map projection, (x,y) of Antarctic polar stereographic.
Technical details, (longitude,latitude) goes by the name WGS84 and EPSG:4326. Antarctic polar stereographic goes by the name EPSG:3031.

Best so far is https://mygeodata.cloud/cs2cs/, but that freezes if I try to translate more than about 100 values at a time, so is not useful for 100,000. Failure 1 is uploading to cloud on same website https://mygeodata.cloud/converter/ but contrary to claims, that doesn’t do any transformations.

Failure 2 is trying to do it using QGIS. The method in https://docs.qgis.org/2.2/en/docs/training_manual/vector_analysis/reproject_transform.html section 7.1.3 failed to work. The method in http://gis.stackexchange.com/questions/17733/changing-coordinate-system-of-qgis-layer-to-projection-of-google-earth doesn’t work. Other answers in stackexchange don’t work.

Failure 3 is trying to do the mathematics directly. This is in “OGP Surveying and Positioning Guidance Note Number 7, part 2”. The worked example in that paper gives a totally and completely wrong answer.

Failure 4 is going back to the definition of “stereographic”. That gives a very wrong answer, too.

Shit.

I’m not home at the moment, replying on my phone. Please put this into the thread and I’ll take a more detailed look later. I’m not sure whether I’ve previously suggested gmt, http://gmt.soest.hawaii.edu/

Moved it to old thread “which sea level”. If you suggested gmt before I missed it. I’ll try it now.

Reply Quote

Date: 5/02/2017 10:22:32
From: mollwollfumble
ID: 1020672
Subject: re: Which sea level?

mollwollfumble said:


btm said:

mollwollfumble said:

Excuse the whinge. Perhaps by listing what doesn’t work I can think of something that does.

I want to transform 100,000 data pairs from (longitude,latitude) to a map projection, (x,y) of Antarctic polar stereographic.
Technical details, (longitude,latitude) goes by the name WGS84 and EPSG:4326. Antarctic polar stereographic goes by the name EPSG:3031….

I’m not home at the moment, replying on my phone. Please put this into the thread and I’ll take a more detailed look later. I’m not sure whether I’ve previously suggested gmt, http://gmt.soest.hawaii.edu/

Moved it to old thread “which sea level”. If you suggested gmt before I missed it. I’ll try it now.

Looking up gmt.

“gmt mapproject latlonfile.txt -Js0/-90/1:1 -C -F > xyfile.txt”

looks like it’s worth a try.

Reply Quote

Date: 5/02/2017 18:45:22
From: mollwollfumble
ID: 1020829
Subject: re: Which sea level?

mollwollfumble said:


mollwollfumble said:

btm said:

I’m not home at the moment, replying on my phone. Please put this into the thread and I’ll take a more detailed look later. I’m not sure whether I’ve previously suggested gmt, http://gmt.soest.hawaii.edu/

Moved it to old thread “which sea level”. If you suggested gmt before I missed it. I’ll try it now.

Looking up gmt.

“gmt mapproject latlonfile.txt -Js0/-90/1:1 -C -F > xyfile.txt”

looks like it’s worth a try.

Good answer btm. The command

“gmt mapproject latlonfile.txt -Js0/-90/1:1 -R-180/180/-83/-60 -C -F > xyfile.txt”

is actually giving me an answer.

Reply Quote

Date: 5/02/2017 18:52:29
From: btm
ID: 1020835
Subject: re: Which sea level?

mollwollfumble said:


mollwollfumble said:

mollwollfumble said:

Moved it to old thread “which sea level”. If you suggested gmt before I missed it. I’ll try it now.

Looking up gmt.

“gmt mapproject latlonfile.txt -Js0/-90/1:1 -C -F > xyfile.txt”

looks like it’s worth a try.

Good answer btm. The command

“gmt mapproject latlonfile.txt -Js0/-90/1:1 -R-180/180/-83/-60 -C -F > xyfile.txt”

is actually giving me an answer.

I hope it’s giving sensible answers :)

Reply Quote

Date: 6/02/2017 01:25:55
From: mollwollfumble
ID: 1020844
Subject: re: Which sea level?

btm said:


mollwollfumble said:

mollwollfumble said:

Looking up gmt.

“gmt mapproject latlonfile.txt -Js0/-90/1:1 -C -F > xyfile.txt”

looks like it’s worth a try.

Good answer btm. The command

“gmt mapproject latlonfile.txt -Js0/-90/1:1 -R-180/180/-83/-60 -C -F > xyfile.txt”

is actually giving me an answer.

I hope it’s giving sensible answers :)

Close but no cigar. I’m happy, I think I can fix. In the following, the white patches are the mountains and the changes in line direction are computed peaks, using the above command to change coordinates. There’s a consistent error of some 20 km or so (I haven’t measured it). I think I can correct for it.

Reply Quote

Date: 6/02/2017 03:34:10
From: mollwollfumble
ID: 1020865
Subject: re: Which sea level?

mollwollfumble said:


btm said:

mollwollfumble said:

Good answer btm. The command

“gmt mapproject latlonfile.txt -Js0/-90/1:1 -R-180/180/-83/-60 -C -F > xyfile.txt”

is actually giving me an answer.

I hope it’s giving sensible answers :)

Close but no cigar. I’m happy, I think I can fix. In the following, the white patches are the mountains and the changes in line direction are computed peaks, using the above command to change coordinates. There’s a consistent error of some 20 km or so (I haven’t measured it). I think I can correct for it.


Consistent error turned out to be 25 to 100 km depending on latitude.
Found a correction that I hoped would give a position error of less than 30 m.

Tried it out – position error of 610 m found. Corection isn’t good enough.

Reply Quote

Date: 6/02/2017 04:29:05
From: mollwollfumble
ID: 1020877
Subject: re: Which sea level?

mollwollfumble said:


mollwollfumble said:

btm said:

I hope it’s giving sensible answers :)

Close but no cigar. I’m happy, I think I can fix. In the following, the white patches are the mountains and the changes in line direction are computed peaks, using the above command to change coordinates. There’s a consistent error of some 20 km or so (I haven’t measured it). I think I can correct for it.


Consistent error turned out to be 25 to 100 km depending on latitude.
Found a correction that I hoped would give a position error of less than 30 m.

Tried it out – position error of 610 m found. Corection isn’t good enough.

Got it. Made up some metadata to feed through gmt mapproject.
Turns out that the error was just a constant scale factor of 2.684%.
A million thanks to btm.

Next step, match up peaks from ASTER data with those from RAMP data. I already know that peaks from RAMP data can be out of position by 2 km and out in height by 400 m. ASTER is much more accurate when it’s not missing peaks or picking up spurious peaks – which it does more often than not.

Reply Quote