Date: 22/05/2018 14:54:41
From: dv
ID: 1229407
Subject: CO2 412 ppm

Having first passed 400 ppm in 2013, atmospheric CO2 oconcentration has already reached 412 ppm. I’m referring to readings from the Mauna Loa Observatory.

https://www.co2.earth/daily-co2
The numbers above are “spots” rather than annual averages but the overall charts do seem to indicate a long term growth rate of about 25 ppm per decade. Probably need to get your skates to achieve the goal of limiting CO2 to 500 ppm.

Pre-industrial levels were at around 280 ppm.

Reply Quote

Date: 22/05/2018 15:01:17
From: party_pants
ID: 1229408
Subject: re: CO2 412 ppm

yep, we need an alternative energy source to crude oil.

Reply Quote

Date: 22/05/2018 15:01:30
From: PermeateFree
ID: 1229409
Subject: re: CO2 412 ppm

dv said:


Having first passed 400 ppm in 2013, atmospheric CO2 oconcentration has already reached 412 ppm. I’m referring to readings from the Mauna Loa Observatory.

https://www.co2.earth/daily-co2
The numbers above are “spots” rather than annual averages but the overall charts do seem to indicate a long term growth rate of about 25 ppm per decade. Probably need to get your skates to achieve the goal of limiting CO2 to 500 ppm.

Pre-industrial levels were at around 280 ppm.

Well as long as they don’t expect anything good is going to come out of this, we can continue on as usual.

Reply Quote

Date: 22/05/2018 17:09:01
From: mollwollfumble
ID: 1229465
Subject: re: CO2 412 ppm

PermeateFree said:


dv said:

Having first passed 400 ppm in 2013, atmospheric CO2 oconcentration has already reached 412 ppm. I’m referring to readings from the Mauna Loa Observatory.

https://www.co2.earth/daily-co2
The numbers above are “spots” rather than annual averages but the overall charts do seem to indicate a long term growth rate of about 25 ppm per decade. Probably need to get your skates to achieve the goal of limiting CO2 to 500 ppm.

Pre-industrial levels were at around 280 ppm.

Well as long as they don’t expect anything good is going to come out of this, we can continue on as usual.

Try this graph. The black line is after removal of the seasonal trend.

https://www.esrl.noaa.gov/gmd/ccgg/trends/

The following graph is the complete record from Mauna Loa since monitoring began.

Reply Quote

Date: 22/05/2018 20:22:48
From: mollwollfumble
ID: 1229518
Subject: re: CO2 412 ppm

CO2
250-350 ppm Normal background concentration in outdoor ambient air
350-1,000 ppm Concentrations typical of occupied indoor spaces with good air exchange
1,000-2,000 ppm Complaints of drowsiness and poor air.
2,000-5,000 ppm Headaches, sleepiness and stagnant, stale, stuffy air. Poor concentration, loss of attention, increased heart rate and slight nausea may also be present.
5,000 ppm Workplace exposure limit (as 8-hour TWA) in most jurisdictions.
>40,000 ppm Exposure may lead to serious oxygen deprivation resulting in permanent brain damage, coma, even death.
Much more. Magician holding breath for 19 minutes.

Reply Quote

Date: 22/05/2018 20:33:19
From: boppa
ID: 1229520
Subject: re: CO2 412 ppm

Interesting question, what other places take co2 measurements?

Reply Quote

Date: 22/05/2018 21:22:04
From: sibeen
ID: 1229525
Subject: re: CO2 412 ppm

mollwollfumble said:


Magician holding breath for 19 minutes.

I suspect the magician may be faking it.

Reply Quote

Date: 23/05/2018 15:29:31
From: mollwollfumble
ID: 1229800
Subject: re: CO2 412 ppm

boppa said:


Interesting question, what other places take co2 measurements?

Satellites do. Satellites ADEOS, GOSAT and OCO-2. But those measurements start in 1996, which is nowhere near as long as Mauna Loa.

Cape Grim on Tasmania’s west coast, run by the CSIRO, was set up to sample pollutants in the purest air in the world. Those measurements started in 1976.
http://capegrim.csiro.au/

Continuous CO2 measurements on the Antarctic peninsula have been taken by the Italians since at least as early as 1994.

The South Pole Observatory has been recording CO2 values since 1981.

Here’s an interesting simulation of CO2 movement around the planet. You can see from this that Mauna Loa observatory is sampling air that is not particularly pure. https://thumbs.gfycat.com/InexperiencedFalseGypsymoth-mobile.mp4

Reply Quote

Date: 23/05/2018 18:29:40
From: boppa
ID: 1229924
Subject: re: CO2 412 ppm

popping, I’m not surprised, I have been watching the current eruption happening there, there are active vents only 30km from the observatory, and the prevailing winds blow almost directly at it most of the times
https://www.google.com/maps/d/viewer?mid=1CvBhH9wEeztBrqYbsGDi4YjU1k1QH5AL&ll=19.451471356185117%2C-154.8999122209625&z=12

IMHO its like using a smog sensor in the middle of a city and claiming it represents the air quality in the middle of the oceam

Reply Quote

Date: 24/05/2018 12:43:00
From: Ian
ID: 1230250
Subject: re: CO2 412 ppm

boppa said:


popping, I’m not surprised, I have been watching the current eruption happening there, there are active vents only 30km from the observatory, and the prevailing winds blow almost directly at it most of the times
https://www.google.com/maps/d/viewer?mid=1CvBhH9wEeztBrqYbsGDi4YjU1k1QH5AL&ll=19.451471356185117%2C-154.8999122209625&z=12

IMHO its like using a smog sensor in the middle of a city and claiming it represents the air quality in the middle of the oceam

“We only detect volcanic CO2 from the Mauna Loa summit late at night at times when the regional winds are light and southerly. Under these conditions, a temperature inversion forms above the ground, and the volcanic emissions are trapped near the surface and travel down our side of the mountain slope. When the volcanic emissions arrive at the observatory, the CO2 analyzer readings increase by several parts per million, and the measured amounts become highly variable for periods of several minutes to a few hours. In the last decade, this has occurred on about 15% of nights between midnight and 6 a.m.

These periods of elevated and variable CO2 levels are so different from the typical measurements that is easy to remove them from the final data set using a simple mathematical “filter.”

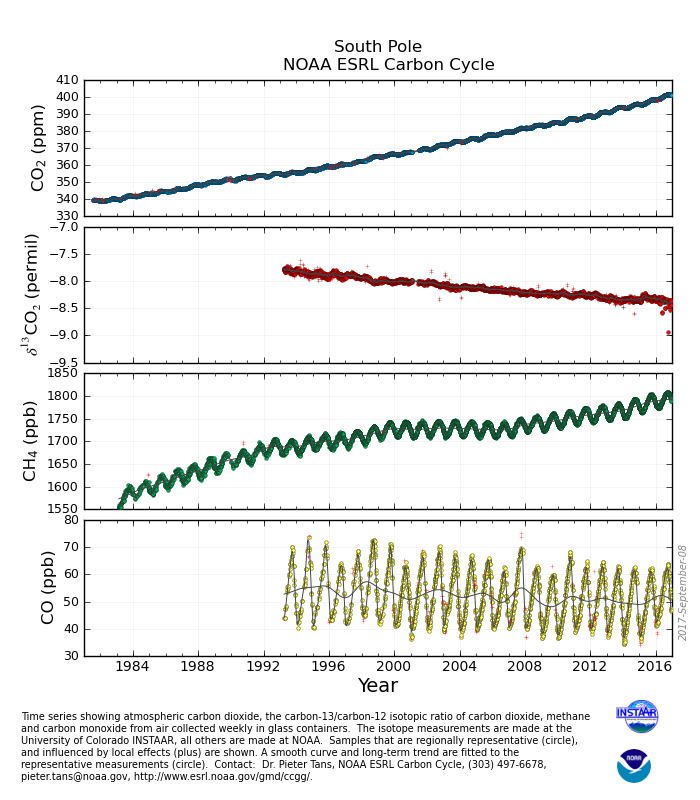
NOAA’s Earth Science Research Laboratory program also measures CO2 in weekly flask samples taken at over 60 remote locations around the world. The Mauna Loa Observatory baseline CO2 concentrations agree very well with flask measurements taken at a similar latitude around the world, which confirms that the volcanic CO2 does not affect our final results. These measurements all show significant increases in CO2 over the last few years.”

https://earthobservatory.nasa.gov/blogs/climateqa/mauna-loa-co2-record/

Reply Quote